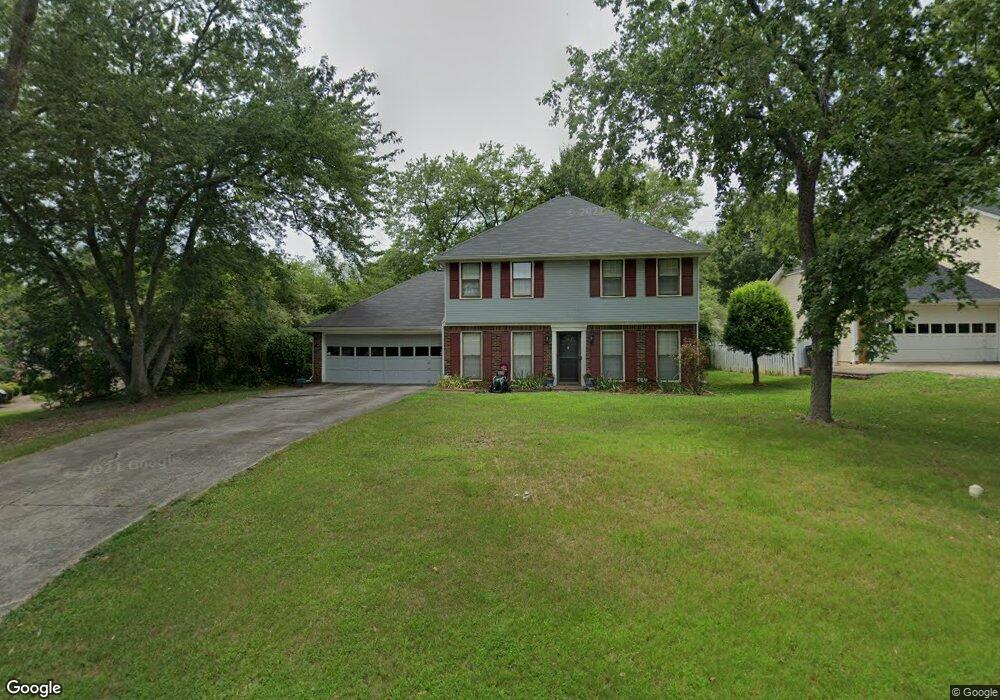
250 Truehedge Trace Unit 1 Roswell, GA 30076
Martin's Landing NeighborhoodEstimated Value: $476,830 - $527,000
3
Beds
3
Baths
1,792
Sq Ft
$283/Sq Ft
Est. Value
About This Home
This home is located at 250 Truehedge Trace Unit 1, Roswell, GA 30076 and is currently estimated at $506,708, approximately $282 per square foot. 250 Truehedge Trace Unit 1 is a home located in Fulton County with nearby schools including Jackson Elementary School, Holcomb Bridge Middle School, and Centennial High School.
Ownership History
Date
Name
Owned For
Owner Type
Purchase Details
Closed on
Mar 18, 2014
Sold by
Nicoll John Charles
Bought by
Nicoll John Charles and Nicoll Emily Ellen
Current Estimated Value
Home Financials for this Owner
Home Financials are based on the most recent Mortgage that was taken out on this home.
Original Mortgage
$134,900
Outstanding Balance
$97,941
Interest Rate
3.27%
Mortgage Type
New Conventional
Estimated Equity
$408,767
Purchase Details
Closed on
Jun 17, 2003
Sold by
Sprott Joe C and Sprott Tara S
Bought by
Nicoll John C and Nicoll Ellen
Home Financials for this Owner
Home Financials are based on the most recent Mortgage that was taken out on this home.
Original Mortgage
$189,150
Interest Rate
5.72%
Mortgage Type
New Conventional
Purchase Details
Closed on
Sep 30, 2002
Sold by
Kraun Herman B and Kraun Helen L
Bought by
Sprout Joe C
Home Financials for this Owner
Home Financials are based on the most recent Mortgage that was taken out on this home.
Original Mortgage
$148,000
Interest Rate
3.88%
Mortgage Type
New Conventional
Create a Home Valuation Report for This Property
The Home Valuation Report is an in-depth analysis detailing your home's value as well as a comparison with similar homes in the area
Home Values in the Area
Average Home Value in this Area
Purchase History
| Date | Buyer | Sale Price | Title Company |
|---|---|---|---|
| Nicoll John Charles | -- | -- | |
| Nicoll John C | $195,000 | -- | |
| Sprout Joe C | $185,000 | -- | |
| Sprott Joe C | -- | -- |
Source: Public Records
Mortgage History
| Date | Status | Borrower | Loan Amount |
|---|---|---|---|
| Open | Nicoll John Charles | $134,900 | |
| Previous Owner | Nicoll John C | $189,150 | |
| Previous Owner | Sprott Joe C | $148,000 |
Source: Public Records
Tax History Compared to Growth
Tax History
| Year | Tax Paid | Tax Assessment Tax Assessment Total Assessment is a certain percentage of the fair market value that is determined by local assessors to be the total taxable value of land and additions on the property. | Land | Improvement |
|---|---|---|---|---|
| 2025 | $467 | $150,000 | $44,560 | $105,440 |
| 2023 | $467 | $157,720 | $44,560 | $113,160 |
| 2022 | $1,861 | $133,320 | $33,120 | $100,200 |
| 2021 | $2,208 | $117,520 | $22,160 | $95,360 |
| 2020 | $2,229 | $86,800 | $18,480 | $68,320 |
| 2019 | $365 | $86,800 | $18,480 | $68,320 |
| 2018 | $2,168 | $92,160 | $18,480 | $73,680 |
| 2017 | $1,691 | $69,920 | $17,520 | $52,400 |
| 2016 | $1,690 | $69,920 | $17,520 | $52,400 |
| 2015 | $2,078 | $69,920 | $17,520 | $52,400 |
| 2014 | $1,386 | $57,960 | $12,040 | $45,920 |
Source: Public Records
Map
Nearby Homes
- 230 Winterberry Ct
- 225 Winterberry Ct
- 406 Teal Ct
- 315 Sea Holly Cir
- 309 Quail Run
- 311 Quail Run
- 227 Quail Run
- 324 Teal Ct
- 150 N Pond Ct Unit 1
- 263 Quail Run
- 125 N Pond Way
- 420 Little Pines Ct
- 2240 Six Branches Dr
- 230 Lakeview Ridge E
- 1050 Terramont Dr
- 130 Lakeview Ridge W
- 9470 Hillside Dr
- 645 Trailmore Place
- 1985 Branch Valley Dr
- 680 Branch Valley Ct
- 230 Truehedge Trace
- 260 Truehedge Trace Unit 1
- 125 Sun Moss Ct Unit 2
- 105 Sea Holly Cir
- 115 Sun Moss Ct
- 220 Truehedge Trace Unit 2
- 270 Truehedge Trace Unit 1
- 245 Truehedge Trace
- 235 Truehedge Trace
- 130 Sun Moss Ct
- 275 Truehedge Trace
- 110 Twinspur Close
- 105 Sun Moss Ct
- 225 Truehedge Trace Unit 2
- 115 Sea Holly Cir
- 210 Truehedge Trace
- 110 Sea Holly Cir
- 120 Sun Moss Ct
- 200 Truehedge Trace
- 120 Twinspur Close Unit 3A