Estimated Value: $385,000 - $609,000
2
Beds
1
Bath
890
Sq Ft
$561/Sq Ft
Est. Value
About This Home
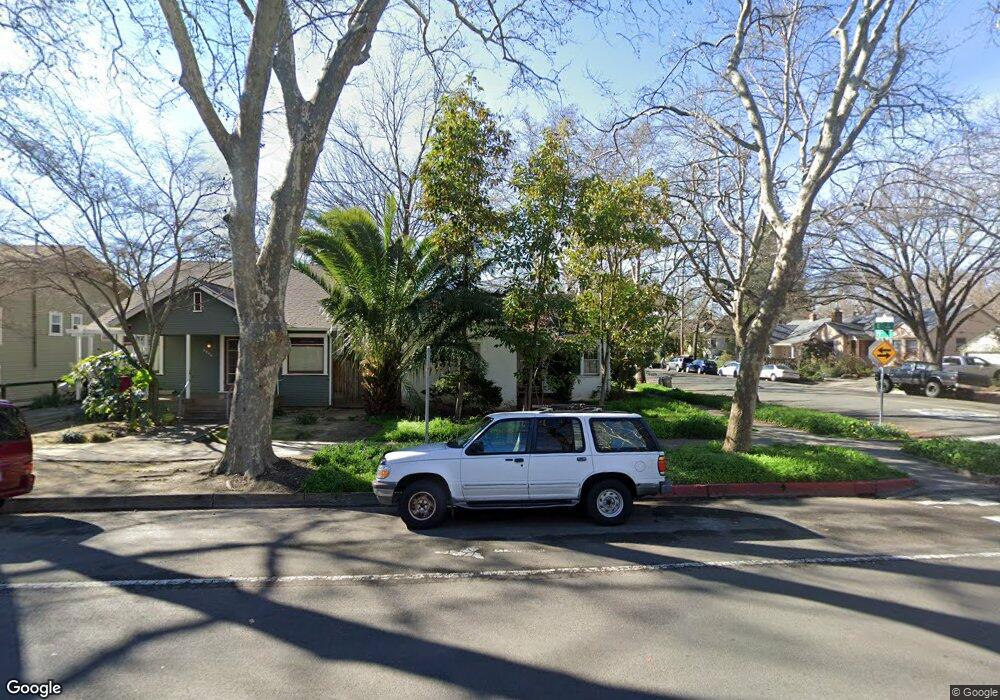
This home is located at 2500 E St, Sacramento, CA 95816 and is currently estimated at $499,458, approximately $561 per square foot. 2500 E St is a home located in Sacramento County with nearby schools including Washington Elementary, Miwok Middle School, and C. K. McClatchy High.
Ownership History
Date
Name
Owned For
Owner Type
Purchase Details
Closed on
Dec 13, 2011
Sold by
Turner Paul
Bought by
Vanhouten Jill
Current Estimated Value
Home Financials for this Owner
Home Financials are based on the most recent Mortgage that was taken out on this home.
Original Mortgage
$25,000
Outstanding Balance
$17,044
Interest Rate
3.94%
Mortgage Type
Seller Take Back
Estimated Equity
$482,414
Purchase Details
Closed on
Feb 11, 2003
Sold by
Johnson Graham G
Bought by
Turner Paul and Vanhouten Jill
Home Financials for this Owner
Home Financials are based on the most recent Mortgage that was taken out on this home.
Original Mortgage
$227,950
Outstanding Balance
$97,198
Interest Rate
5.89%
Estimated Equity
$402,260
Create a Home Valuation Report for This Property
The Home Valuation Report is an in-depth analysis detailing your home's value as well as a comparison with similar homes in the area
Home Values in the Area
Average Home Value in this Area
Purchase History
| Date | Buyer | Sale Price | Title Company |
|---|---|---|---|
| Vanhouten Jill | -- | Stewart Title | |
| Turner Paul | $235,000 | Fidelity National Title Co |
Source: Public Records
Mortgage History
| Date | Status | Borrower | Loan Amount |
|---|---|---|---|
| Open | Vanhouten Jill | $25,000 | |
| Open | Turner Paul | $227,950 |
Source: Public Records
Tax History
| Year | Tax Paid | Tax Assessment Tax Assessment Total Assessment is a certain percentage of the fair market value that is determined by local assessors to be the total taxable value of land and additions on the property. | Land | Improvement |
|---|---|---|---|---|
| 2025 | $4,449 | $340,335 | $108,613 | $231,722 |
| 2024 | $4,449 | $333,663 | $106,484 | $227,179 |
| 2023 | $5,696 | $327,122 | $104,397 | $222,725 |
| 2022 | $4,424 | $320,708 | $102,350 | $218,358 |
| 2021 | $5,192 | $314,421 | $100,344 | $214,077 |
| 2020 | $3,742 | $311,198 | $99,316 | $211,882 |
| 2019 | $3,663 | $305,097 | $97,369 | $207,728 |
| 2018 | $5,483 | $299,115 | $95,460 | $203,655 |
| 2017 | $3,520 | $293,251 | $93,589 | $199,662 |
| 2016 | $4,115 | $287,502 | $91,754 | $195,748 |
| 2015 | $3,850 | $283,184 | $90,376 | $192,808 |
| 2014 | $4,232 | $277,638 | $88,606 | $189,032 |
Source: Public Records
Map
Nearby Homes
Your Personal Tour Guide
Ask me questions while you tour the home.