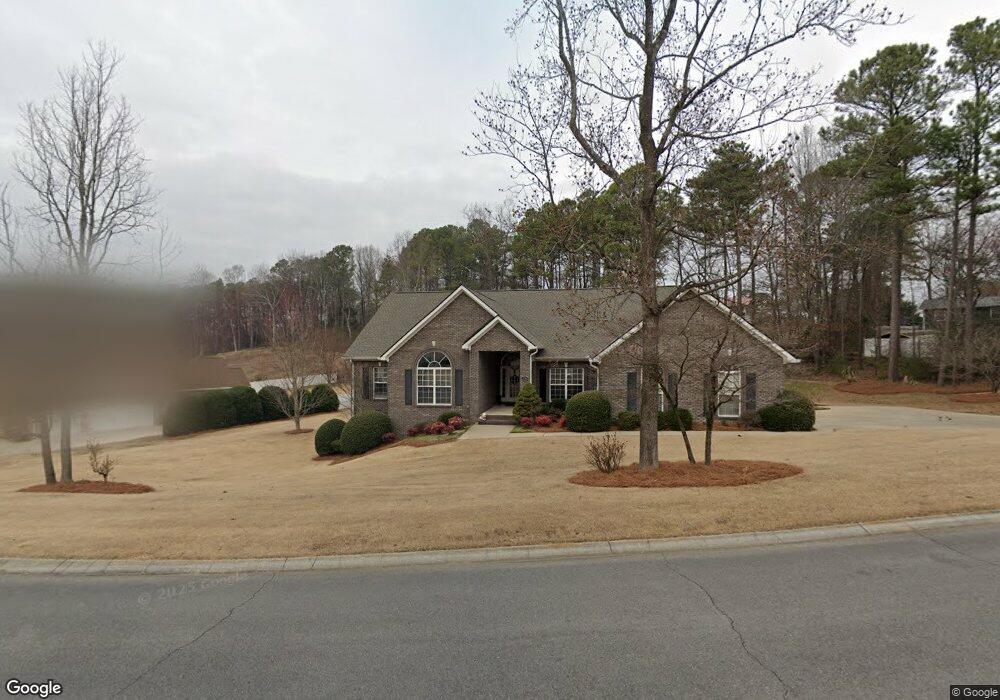
2500 Falcon Dr Dalton, GA 30721
Estimated Value: $425,389 - $473,000
4
Beds
3
Baths
4,922
Sq Ft
$93/Sq Ft
Est. Value
About This Home
This home is located at 2500 Falcon Dr, Dalton, GA 30721 and is currently estimated at $456,130, approximately $92 per square foot. 2500 Falcon Dr is a home located in Whitfield County with nearby schools including New Hope Elementary School, New Hope Middle School, and Northwest Whitfield County High School.
Ownership History
Date
Name
Owned For
Owner Type
Purchase Details
Closed on
Apr 24, 2009
Sold by
Holloway Philip B
Bought by
Hankins Karen L
Current Estimated Value
Home Financials for this Owner
Home Financials are based on the most recent Mortgage that was taken out on this home.
Original Mortgage
$224,000
Outstanding Balance
$140,995
Interest Rate
4.86%
Mortgage Type
New Conventional
Estimated Equity
$315,135
Purchase Details
Closed on
Dec 15, 2003
Sold by
Driggans Jimmy
Bought by
Holloway Phillip B and Holloway Dana L
Purchase Details
Closed on
Aug 5, 2002
Sold by
Byrd Christopher R and Byrd Christa L
Bought by
Driggans Jimmy
Purchase Details
Closed on
Sep 14, 2000
Sold by
Cook & Cochran Llc
Bought by
Byrd Christopher R and Byrd Christa L
Purchase Details
Closed on
Nov 1, 1998
Bought by
Cook & Cochran Llc
Create a Home Valuation Report for This Property
The Home Valuation Report is an in-depth analysis detailing your home's value as well as a comparison with similar homes in the area
Home Values in the Area
Average Home Value in this Area
Purchase History
| Date | Buyer | Sale Price | Title Company |
|---|---|---|---|
| Hankins Karen L | $280,000 | -- | |
| Holloway Phillip B | $289,000 | -- | |
| Driggans Jimmy | $29,000 | -- | |
| Byrd Christopher R | $28,000 | -- | |
| Cook & Cochran Llc | -- | -- |
Source: Public Records
Mortgage History
| Date | Status | Borrower | Loan Amount |
|---|---|---|---|
| Open | Hankins Karen L | $224,000 |
Source: Public Records
Tax History Compared to Growth
Tax History
| Year | Tax Paid | Tax Assessment Tax Assessment Total Assessment is a certain percentage of the fair market value that is determined by local assessors to be the total taxable value of land and additions on the property. | Land | Improvement |
|---|---|---|---|---|
| 2024 | $3,479 | $171,502 | $26,000 | $145,502 |
| 2023 | $3,479 | $123,155 | $16,000 | $107,155 |
| 2022 | $3,065 | $112,468 | $13,240 | $99,228 |
| 2021 | $3,066 | $112,468 | $13,240 | $99,228 |
| 2020 | $3,158 | $112,468 | $13,240 | $99,228 |
| 2019 | $3,205 | $112,468 | $13,240 | $99,228 |
| 2018 | $3,251 | $112,468 | $13,240 | $99,228 |
| 2017 | $3,252 | $112,468 | $13,240 | $99,228 |
| 2016 | $2,956 | $106,358 | $11,360 | $94,998 |
| 2014 | $2,664 | $106,358 | $11,360 | $94,998 |
| 2013 | -- | $106,358 | $11,360 | $94,998 |
Source: Public Records
Map
Nearby Homes
- 1015 S Ridge Dr
- 1425 Wiggs Dr
- 0 West R W Ridge Dr
- 609 Cherokee Trail NW
- 1626 Lagenia Ct
- 2256 Waring Rd NW
- 2215 Kerr Rd NW
- 466 Scarlet Dr
- 287 Williams Rd NW
- 303 Cherokee Trail NW
- 1016 Prince Way
- 1247 Reed Rd
- 192 Carly Dr
- 213 Grassdale Rd
- 3025 Cleveland Hwy
- 112 Albertson Dr
- 106 Albertson Dr
- 3147 Cleveland Hwy
- 2002 Broadacre Dr NW
- 2508 Falcon Dr
- 2505 Falcon Dr
- 2103 Millican Ln
- 1001 Peregrine Way
- 2512 Falcon Dr
- 2101 Millican Ln
- 0 Falcon Dr
- lot 22 Falcon Dr
- 2105 Millican Ln
- 2703 Osprey Dr Unit 1
- 2703 Osprey Dr
- 2516 Falcon Dr
- 2107 Millican Ln
- 2700 Osprey Dr
- 2455 Falcon Dr
- 2709 Osprey Dr
- 2104 Millican Ln
- 2522 Falcon Dr
- 2102 Millican Ln
- 1005 Peregrine Way