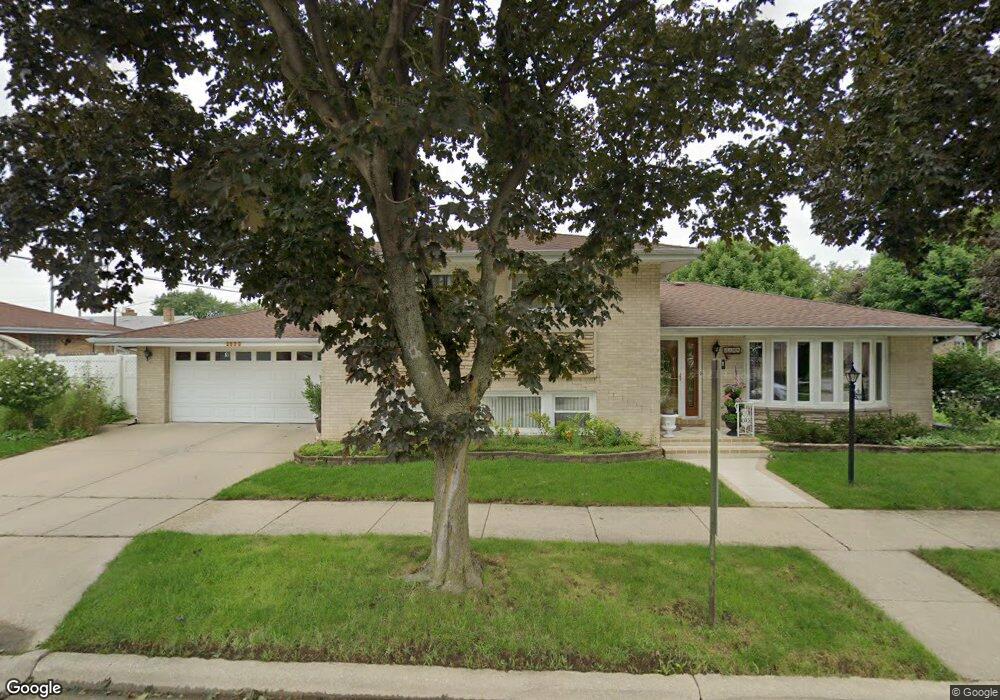
2500 George St Franklin Park, IL 60131
Estimated Value: $373,000 - $443,000
3
Beds
2
Baths
1,620
Sq Ft
$248/Sq Ft
Est. Value
About This Home
This home is located at 2500 George St, Franklin Park, IL 60131 and is currently estimated at $401,957, approximately $248 per square foot. 2500 George St is a home located in Cook County with nearby schools including Scott Elementary School, Mannheim Middle School, and West Leyden High School.
Ownership History
Date
Name
Owned For
Owner Type
Purchase Details
Closed on
Mar 31, 2017
Sold by
Gregory Guy and Kurpa Gloria
Bought by
Restrepo Luis F and Espitia Martha
Current Estimated Value
Home Financials for this Owner
Home Financials are based on the most recent Mortgage that was taken out on this home.
Original Mortgage
$234,671
Outstanding Balance
$196,288
Interest Rate
4.4%
Mortgage Type
FHA
Estimated Equity
$205,669
Purchase Details
Closed on
May 28, 1999
Sold by
Ranieri Mollie C
Bought by
Gregory Guy and Krupa Gloria
Home Financials for this Owner
Home Financials are based on the most recent Mortgage that was taken out on this home.
Original Mortgage
$159,600
Interest Rate
6.94%
Purchase Details
Closed on
Mar 19, 1996
Sold by
Ranieri Mollie C
Bought by
Ranieri Mollie C
Purchase Details
Closed on
Mar 10, 1994
Sold by
Ranieri Alfred A and Ranieri Mollie C
Bought by
Ranieri Mollie C
Create a Home Valuation Report for This Property
The Home Valuation Report is an in-depth analysis detailing your home's value as well as a comparison with similar homes in the area
Home Values in the Area
Average Home Value in this Area
Purchase History
| Date | Buyer | Sale Price | Title Company |
|---|---|---|---|
| Restrepo Luis F | $239,000 | Heritage Title Company | |
| Gregory Guy | $168,000 | -- | |
| Ranieri Mollie C | -- | -- | |
| Ranieri Mollie C | -- | -- |
Source: Public Records
Mortgage History
| Date | Status | Borrower | Loan Amount |
|---|---|---|---|
| Open | Restrepo Luis F | $234,671 | |
| Previous Owner | Gregory Guy | $159,600 |
Source: Public Records
Tax History Compared to Growth
Tax History
| Year | Tax Paid | Tax Assessment Tax Assessment Total Assessment is a certain percentage of the fair market value that is determined by local assessors to be the total taxable value of land and additions on the property. | Land | Improvement |
|---|---|---|---|---|
| 2024 | $10,200 | $32,000 | $4,512 | $27,488 |
| 2023 | $10,083 | $32,000 | $4,512 | $27,488 |
| 2022 | $10,083 | $32,000 | $4,512 | $27,488 |
| 2021 | $9,452 | $25,059 | $3,609 | $21,450 |
| 2020 | $9,384 | $25,059 | $3,609 | $21,450 |
| 2019 | $9,765 | $28,220 | $3,609 | $24,611 |
| 2018 | $8,386 | $21,539 | $3,008 | $18,531 |
| 2017 | $7,034 | $21,539 | $3,008 | $18,531 |
| 2016 | $6,913 | $21,539 | $3,008 | $18,531 |
| 2015 | $6,778 | $20,267 | $2,707 | $17,560 |
| 2014 | $6,673 | $20,267 | $2,707 | $17,560 |
| 2013 | $6,386 | $20,267 | $2,707 | $17,560 |
Source: Public Records
Map
Nearby Homes
- 2520 Dora St
- 10131 Nevada Ave
- 10213 W Lyndale Ave
- 10501 Schubert Ave
- 10115 Belden Ave
- 2632 Westbrook Dr
- 10510 W Fullerton Ave
- 10459 Diversey Ave
- 2749 Scott St
- 9907 W Fullerton Ave
- 2118 Fairfield Ave
- 10417 W Palmer Ave
- 2920 Sarah St
- 2933 Lincoln St
- 2743 Bellwood Ave
- 2807 Elder Ln
- 2843 Hawthorne St
- 10445 W Palmer Ave
- 2829 Elder Ln
- 9727 Johanna Ave