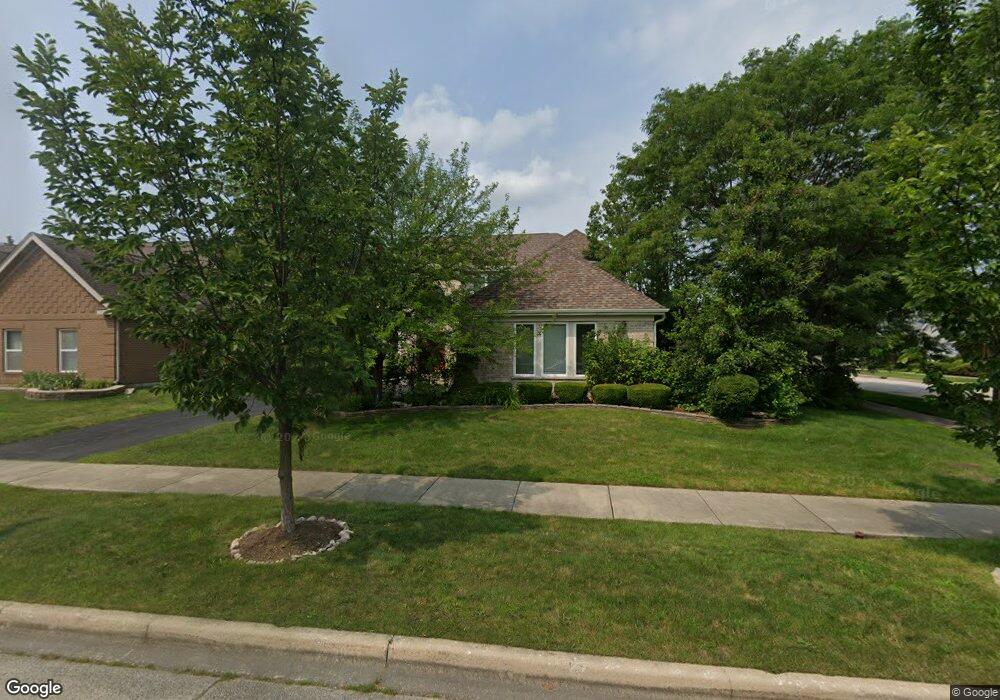
2500 Joshua Ln Northbrook, IL 60062
Estimated Value: $998,000 - $1,065,101
4
Beds
3
Baths
3,515
Sq Ft
$293/Sq Ft
Est. Value
About This Home
This home is located at 2500 Joshua Ln, Northbrook, IL 60062 and is currently estimated at $1,029,775, approximately $292 per square foot. 2500 Joshua Ln is a home located in Cook County with nearby schools including Henry Winkelman Elementary School, Field Middle School, and Glenbrook North High School.
Ownership History
Date
Name
Owned For
Owner Type
Purchase Details
Closed on
Oct 26, 2017
Sold by
Park Won Sun and Park Kyong Ok
Bought by
Furtado Beverly and Kumar Sanjeev
Current Estimated Value
Home Financials for this Owner
Home Financials are based on the most recent Mortgage that was taken out on this home.
Original Mortgage
$422,500
Outstanding Balance
$105,527
Interest Rate
3.78%
Mortgage Type
New Conventional
Estimated Equity
$924,248
Purchase Details
Closed on
Oct 9, 2007
Sold by
Park Won Sun and Park Kyong Ok
Bought by
Park Won Sun and Won Sun Park Declaration Of Trust
Purchase Details
Closed on
Jul 8, 1998
Sold by
American National Bk & Tr Co Of Chicago
Bought by
Park Won Sun and Park Kyong Ok
Home Financials for this Owner
Home Financials are based on the most recent Mortgage that was taken out on this home.
Original Mortgage
$150,000
Interest Rate
7.15%
Create a Home Valuation Report for This Property
The Home Valuation Report is an in-depth analysis detailing your home's value as well as a comparison with similar homes in the area
Home Values in the Area
Average Home Value in this Area
Purchase History
| Date | Buyer | Sale Price | Title Company |
|---|---|---|---|
| Furtado Beverly | $702,500 | Chicago Title | |
| Park Won Sun | -- | None Available | |
| Park Won Sun | $470,500 | -- |
Source: Public Records
Mortgage History
| Date | Status | Borrower | Loan Amount |
|---|---|---|---|
| Open | Furtado Beverly | $422,500 | |
| Previous Owner | Park Won Sun | $150,000 |
Source: Public Records
Tax History Compared to Growth
Tax History
| Year | Tax Paid | Tax Assessment Tax Assessment Total Assessment is a certain percentage of the fair market value that is determined by local assessors to be the total taxable value of land and additions on the property. | Land | Improvement |
|---|---|---|---|---|
| 2024 | $15,476 | $74,000 | $16,294 | $57,706 |
| 2023 | $15,311 | $74,000 | $16,294 | $57,706 |
| 2022 | $15,311 | $74,000 | $16,294 | $57,706 |
| 2021 | $16,876 | $67,262 | $11,711 | $55,551 |
| 2020 | $16,159 | $67,262 | $11,711 | $55,551 |
| 2019 | $15,745 | $73,915 | $11,711 | $62,204 |
| 2018 | $15,634 | $67,926 | $10,184 | $57,742 |
| 2017 | $13,864 | $67,926 | $10,184 | $57,742 |
| 2016 | $14,939 | $71,103 | $10,184 | $60,919 |
| 2015 | $13,996 | $64,963 | $8,147 | $56,816 |
| 2014 | $14,509 | $64,963 | $8,147 | $56,816 |
| 2013 | $13,223 | $64,963 | $8,147 | $56,816 |
Source: Public Records
Map
Nearby Homes
- 2809 Meadowview Ct
- 3263 Doriann Dr
- 4250 Meadowview Dr
- 2803 Wildflower Ct
- 3005 Highland Rd
- 4036 Miller Dr
- 2960 Willow Rd
- 2290 Cedar Ct
- 2250 White Oak Dr
- 2503 Indian Ridge Dr
- 3931 Miller Dr
- 3026 Glenway Dr
- 2509 Astor Ct
- 1925 Ivy Ln
- 240 Violet Ln
- 250 Violet Ln
- 3190 Landwehr Rd
- 2308 Indian Ridge Dr
- 3800 Kiess Dr
- 3820 Kiess Dr
- 2512 Joshua Ln
- 2503 Melanie Ln
- 2524 Joshua Ln
- 2515 Melanie Ln
- 3216 Highland Rd
- 3216 Highland Rd
- 2527 Melanie Ln
- 2536 Joshua Ln
- 3208 Highland Rd
- 3230 Highland Rd
- 2539 Melanie Ln
- 2548 Joshua Ln
- 3248 Highland Rd
- 2551 Melanie Ln
- 2502 Melanie Ln
- 2514 Melanie Ln
- 2560 Joshua Ln
- 3258 Highland Rd
- 2526 Melanie Ln
- 2563 Melanie Ln