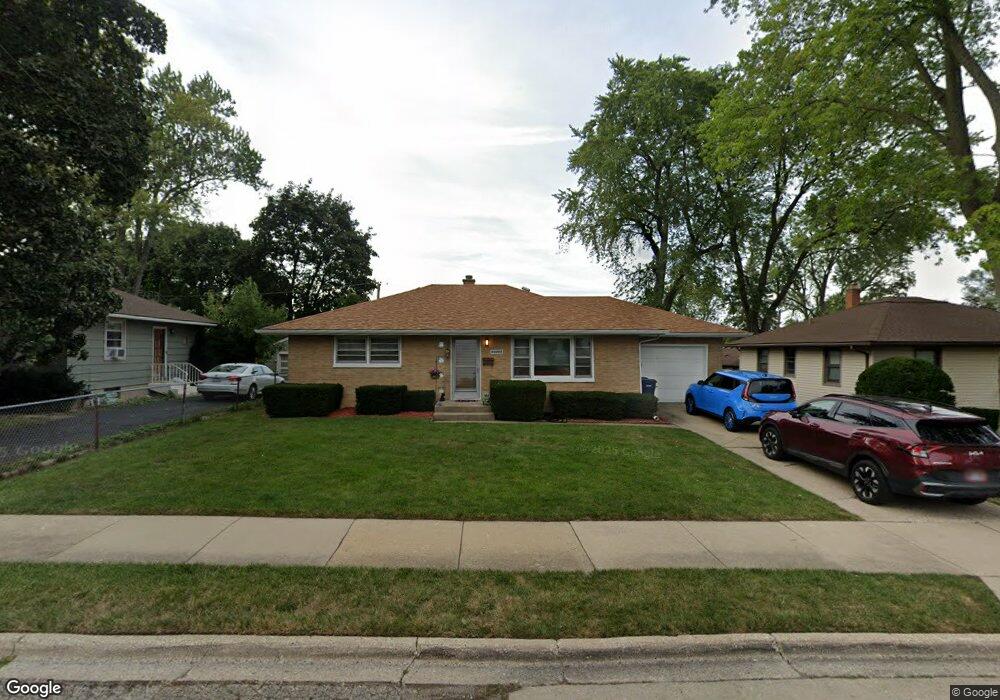
2500 Nemery Ct Waukegan, IL 60085
Glenwood Heights NeighborhoodEstimated Value: $215,000 - $304,000
2
Beds
1
Bath
1,064
Sq Ft
$233/Sq Ft
Est. Value
About This Home
This home is located at 2500 Nemery Ct, Waukegan, IL 60085 and is currently estimated at $247,759, approximately $232 per square foot. 2500 Nemery Ct is a home located in Lake County with nearby schools including Glenwood Elementary School, Miguel Juarez Middle School, and Waukegan High School.
Ownership History
Date
Name
Owned For
Owner Type
Purchase Details
Closed on
Jul 28, 2009
Sold by
Cruz James and Cruz Jody L
Bought by
Cruz James and Cruz Jody L
Current Estimated Value
Purchase Details
Closed on
Jun 6, 2003
Sold by
Cruz James and Cruz Jody L
Bought by
Cruz James and Cruz Jody L
Home Financials for this Owner
Home Financials are based on the most recent Mortgage that was taken out on this home.
Original Mortgage
$65,380
Interest Rate
5.37%
Mortgage Type
Purchase Money Mortgage
Purchase Details
Closed on
Mar 26, 2001
Sold by
Cruz James
Bought by
Cruz James
Home Financials for this Owner
Home Financials are based on the most recent Mortgage that was taken out on this home.
Original Mortgage
$68,000
Interest Rate
7.13%
Purchase Details
Closed on
Nov 20, 1997
Sold by
Cruz James
Bought by
Cruz James and Cruz Jody
Create a Home Valuation Report for This Property
The Home Valuation Report is an in-depth analysis detailing your home's value as well as a comparison with similar homes in the area
Home Values in the Area
Average Home Value in this Area
Purchase History
| Date | Buyer | Sale Price | Title Company |
|---|---|---|---|
| Cruz James | -- | None Available | |
| Cruz James | -- | Nations Title Agency Inc | |
| Cruz James | -- | First American Title | |
| Cruz James | -- | -- | |
| Cruz James | -- | -- |
Source: Public Records
Mortgage History
| Date | Status | Borrower | Loan Amount |
|---|---|---|---|
| Closed | Cruz James | $65,380 | |
| Closed | Cruz James | $68,000 |
Source: Public Records
Tax History Compared to Growth
Tax History
| Year | Tax Paid | Tax Assessment Tax Assessment Total Assessment is a certain percentage of the fair market value that is determined by local assessors to be the total taxable value of land and additions on the property. | Land | Improvement |
|---|---|---|---|---|
| 2024 | $4,616 | $63,615 | $10,176 | $53,439 |
| 2023 | $4,626 | $56,956 | $9,111 | $47,845 |
| 2022 | $4,626 | $53,318 | $7,698 | $45,620 |
| 2021 | $3,973 | $44,112 | $6,763 | $37,349 |
| 2020 | $3,978 | $41,096 | $6,301 | $34,795 |
| 2019 | $3,951 | $37,658 | $5,774 | $31,884 |
| 2018 | $3,768 | $34,387 | $7,356 | $27,031 |
| 2017 | $3,474 | $30,423 | $6,508 | $23,915 |
| 2016 | $3,158 | $26,436 | $5,655 | $20,781 |
| 2015 | $2,983 | $23,660 | $5,061 | $18,599 |
| 2014 | $3,258 | $24,798 | $6,627 | $18,171 |
| 2012 | $4,258 | $26,866 | $7,180 | $19,686 |
Source: Public Records
Map
Nearby Homes
- 1425 N Mcaree Rd
- 12352 W Atlantic Ave
- 12787 W Grove Ave
- 1019 N Lewis Ave
- 1005 N Lewis Ave
- 1213 Grand Ave
- 1038 Indiana Ave
- 2009 Harding Ave
- 2008 Harding Ave
- 2810 W Atlantic Ave
- 2115 Lydia St
- 968 Judge Ave
- 2207 Williamsburg Dr
- 1001 Judge Ave
- 1117 Judge Ave
- 0 Brookside Ave
- 1745 N Frolic Ave
- 12698 W Grandview Ave
- 2715 W Greenwood Ave
- 12716 W Grandview Ave
- 2510 Nemery Ct
- 2410 Nemery Ct
- 2501 Northmoor Ave
- 2425 Northmoor Ave
- 2516 Nemery Ct
- 1050 Flossmoor Ave
- 2515 Northmoor Ave
- 2507 Nemery Ct
- 1066 Flossmoor Ave
- 2511 Nemery Ct
- 2439 Nemery Ct
- 1057 N Mcaree Rd
- 2515 Nemery Ct
- 2435 Nemery Ct
- 2521 Northmoor Ave
- 1045 N Mcaree Rd
- 1034 Flossmoor Ave
- 1061 Flossmoor Ave
- 1043 N Mcaree Rd
- 1030 Flossmoor Ave