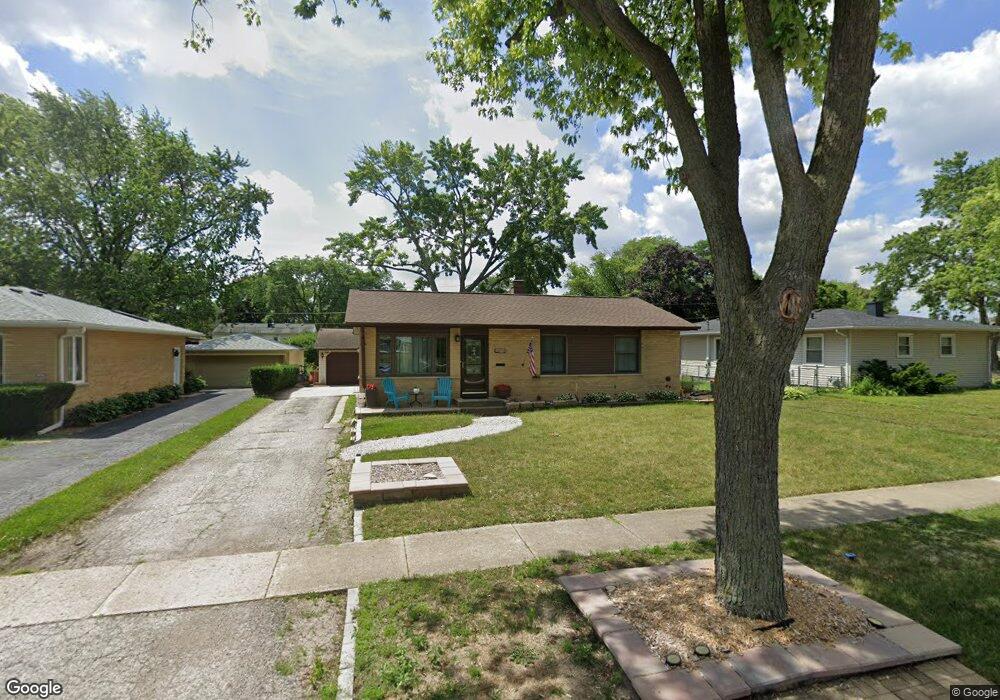
2501 Cedar St Unit 2 Rolling Meadows, IL 60008
Busse Woods NeighborhoodEstimated Value: $325,000 - $475,000
3
Beds
2
Baths
1,000
Sq Ft
$374/Sq Ft
Est. Value
About This Home
This home is located at 2501 Cedar St Unit 2, Rolling Meadows, IL 60008 and is currently estimated at $374,373, approximately $374 per square foot. 2501 Cedar St Unit 2 is a home located in Cook County with nearby schools including Willow Bend Elementary School, Carl Sandburg Junior High School, and Rolling Meadows High School.
Ownership History
Date
Name
Owned For
Owner Type
Purchase Details
Closed on
Feb 28, 2011
Sold by
Wier Kenneth and Wier Lynn
Bought by
Novesky Michael R and Wagrowski Janette A
Current Estimated Value
Home Financials for this Owner
Home Financials are based on the most recent Mortgage that was taken out on this home.
Original Mortgage
$248,535
Outstanding Balance
$168,189
Interest Rate
4.78%
Mortgage Type
FHA
Estimated Equity
$206,184
Purchase Details
Closed on
Jan 30, 2004
Sold by
Wier Kenneth and Wier Lynn
Bought by
Wier Kenneth and Wier Lynn
Home Financials for this Owner
Home Financials are based on the most recent Mortgage that was taken out on this home.
Original Mortgage
$205,600
Interest Rate
5.96%
Mortgage Type
New Conventional
Purchase Details
Closed on
Aug 29, 2002
Sold by
Rogers Roland R and Rogers Roland
Bought by
Wier Kenneth and Weston Lynn
Home Financials for this Owner
Home Financials are based on the most recent Mortgage that was taken out on this home.
Original Mortgage
$181,600
Interest Rate
6.01%
Mortgage Type
Unknown
Create a Home Valuation Report for This Property
The Home Valuation Report is an in-depth analysis detailing your home's value as well as a comparison with similar homes in the area
Home Values in the Area
Average Home Value in this Area
Purchase History
| Date | Buyer | Sale Price | Title Company |
|---|---|---|---|
| Novesky Michael R | $255,000 | Heritage Title Company | |
| Wier Kenneth | -- | -- | |
| Wier Kenneth | $227,000 | 1St American Title |
Source: Public Records
Mortgage History
| Date | Status | Borrower | Loan Amount |
|---|---|---|---|
| Open | Novesky Michael R | $248,535 | |
| Previous Owner | Wier Kenneth | $205,600 | |
| Previous Owner | Wier Kenneth | $181,600 | |
| Closed | Wier Kenneth | $22,700 |
Source: Public Records
Tax History
| Year | Tax Paid | Tax Assessment Tax Assessment Total Assessment is a certain percentage of the fair market value that is determined by local assessors to be the total taxable value of land and additions on the property. | Land | Improvement |
|---|---|---|---|---|
| 2025 | $6,928 | $27,000 | $7,410 | $19,590 |
| 2024 | $6,928 | $26,000 | $6,240 | $19,760 |
| 2023 | $6,598 | $26,000 | $6,240 | $19,760 |
| 2022 | $6,598 | $26,000 | $6,240 | $19,760 |
| 2021 | $5,173 | $19,035 | $3,900 | $15,135 |
| 2020 | $5,125 | $19,035 | $3,900 | $15,135 |
| 2019 | $5,128 | $21,150 | $3,900 | $17,250 |
| 2018 | $6,723 | $24,289 | $3,510 | $20,779 |
| 2017 | $6,606 | $24,289 | $3,510 | $20,779 |
| 2016 | $6,411 | $24,289 | $3,510 | $20,779 |
| 2015 | $6,565 | $23,579 | $2,925 | $20,654 |
| 2014 | $6,426 | $23,579 | $2,925 | $20,654 |
| 2013 | $6,253 | $23,579 | $2,925 | $20,654 |
Source: Public Records
Map
Nearby Homes
- 2302 Fulle St
- 2830 Northampton Dr Unit A1
- 1117 S Old Wilke Rd Unit 206
- 1107 S Old Wilke Rd Unit 103
- 1126 S New Wilke Rd Unit 307
- 2504 Algonquin Rd Unit 14
- 4980 Kimball Hill Dr Unit C2
- 3712 Jay Ln
- 2402 Algonquin Rd Unit 9
- 1227 S Old Wilke Rd Unit 201
- 1227 S Old Wilke Rd Unit 306
- 5000 Carriageway Dr Unit 305
- 5000 Carriageway Dr Unit 315
- 3710 Meadow Dr
- 5001 Carriageway Dr Unit 215
- 3605 Oriole Ln
- 1363 S Old Wilke Rd Unit 27
- 1322 S New Wilke Rd Unit 1C
- 2201 Kingfisher Ln
- 3200 Thrush Ln
Your Personal Tour Guide
Ask me questions while you tour the home.