Estimated Value: $130,000 - $209,000
3
Beds
1
Bath
1,179
Sq Ft
$148/Sq Ft
Est. Value
About This Home
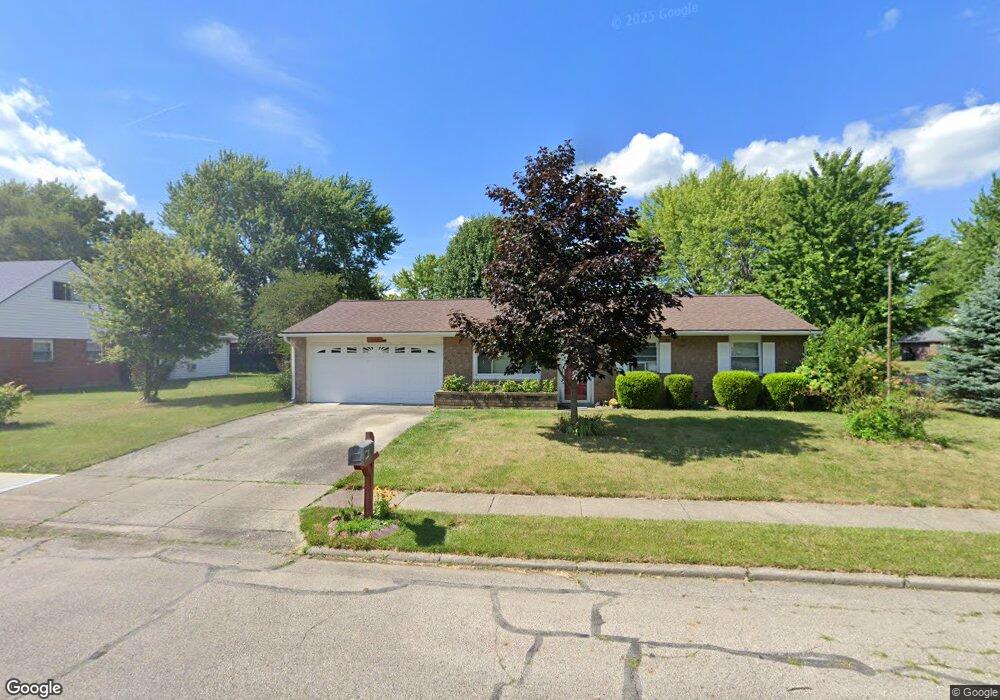
This home is located at 2501 Foxchase Ct W, Troy, OH 45373 and is currently estimated at $174,615, approximately $148 per square foot. 2501 Foxchase Ct W is a home located in Miami County with nearby schools including Hook Elementary School, Troy Junior High School, and Van Cleve Elementary School.
Ownership History
Date
Name
Owned For
Owner Type
Purchase Details
Closed on
Apr 10, 2025
Sold by
Mamitag Luz M and Mamitag Luz Montebon
Bought by
Mamitag Gerald
Current Estimated Value
Home Financials for this Owner
Home Financials are based on the most recent Mortgage that was taken out on this home.
Original Mortgage
$119,700
Outstanding Balance
$119,180
Interest Rate
6.76%
Mortgage Type
New Conventional
Estimated Equity
$55,435
Purchase Details
Closed on
Apr 11, 2011
Sold by
Kingrey Margaret M
Bought by
Mamitag Luz M
Home Financials for this Owner
Home Financials are based on the most recent Mortgage that was taken out on this home.
Original Mortgage
$97,465
Interest Rate
4.99%
Mortgage Type
FHA
Purchase Details
Closed on
May 26, 2000
Sold by
Kingrey Charles M and Kingrey Margaret M
Bought by
Kingrey Charles M and Charles M Kingrey Trust
Purchase Details
Closed on
Oct 3, 1991
Bought by
Kingrey Charles M
Create a Home Valuation Report for This Property
The Home Valuation Report is an in-depth analysis detailing your home's value as well as a comparison with similar homes in the area
Home Values in the Area
Average Home Value in this Area
Purchase History
| Date | Buyer | Sale Price | Title Company |
|---|---|---|---|
| Mamitag Gerald | $126,000 | Northwest Title | |
| Mamitag Luz M | $100,000 | -- | |
| Kingrey Charles M | -- | -- | |
| Kingrey Charles M | $69,900 | -- |
Source: Public Records
Mortgage History
| Date | Status | Borrower | Loan Amount |
|---|---|---|---|
| Open | Mamitag Gerald | $119,700 | |
| Previous Owner | Kingrey Charles M | $97,465 |
Source: Public Records
Tax History Compared to Growth
Tax History
| Year | Tax Paid | Tax Assessment Tax Assessment Total Assessment is a certain percentage of the fair market value that is determined by local assessors to be the total taxable value of land and additions on the property. | Land | Improvement |
|---|---|---|---|---|
| 2024 | $1,959 | $48,550 | $11,900 | $36,650 |
| 2023 | $1,959 | $48,550 | $11,900 | $36,650 |
| 2022 | $1,524 | $48,550 | $11,900 | $36,650 |
| 2021 | $1,146 | $34,690 | $8,510 | $26,180 |
| 2020 | $1,148 | $34,690 | $8,510 | $26,180 |
| 2019 | $1,159 | $34,690 | $8,510 | $26,180 |
| 2018 | $1,094 | $31,540 | $8,860 | $22,680 |
| 2017 | $1,106 | $31,540 | $8,860 | $22,680 |
| 2016 | $1,089 | $31,540 | $8,860 | $22,680 |
| 2015 | $1,093 | $30,320 | $8,510 | $21,810 |
| 2014 | $1,093 | $30,320 | $8,510 | $21,810 |
| 2013 | $1,099 | $30,320 | $8,510 | $21,810 |
Source: Public Records
Map
Nearby Homes
- 2511 Glenmore Ct
- 2513 Glenmore Ct
- 2722-2724 Fairview Ct
- 2600 Meadowpoint Dr
- 2455 Lupine Ct
- 2791 Meadowpoint Dr
- 2365 Murphy Ln W
- 2290 Murphy Ln E
- 2430 Coriander Ct
- 1645 Cornish Rd
- 1601 Henley Rd
- 622 Windsor Rd
- 1144 Red Maple Dr
- 3318 Heatherstone Dr
- 1248 Waterbury Place
- 143 S Dorset Rd
- 1395 Covent Rd
- 3262 Heatherstone Dr
- 1360 Croydon Rd
- 2261 Lytle Rd
- 302 Kings Chapel Dr
- 2503 Foxchase Ct W
- 2500 Thornhill Dr
- 2505 Foxchase Ct W
- 400 Kings Chapel Dr
- 303 Kings Chapel Dr
- 2502 Thornhill Dr
- 2502 Foxchase Ct W
- 2504 Foxchase Ct W
- 2504 Thornhill Dr
- 301 Kings Chapel Dr
- 2507 Foxchase Ct W
- 401 Kings Chapel Dr
- 2485 Foxchase Ct E
- 2506 Foxchase Ct W
- 2506 Thornhill Dr
- 2488 Thornhill Dr
- 2488 Foxchase Ct E
- 2509 Foxchase Ct W
- 2501 Thornhill Dr