NOT LISTED FOR SALE

2501 W Queensbury Rd Muncie, IN 47304

Halteman Neighborhood

Estimated Value: $183,000 - $204,000

2 Beds
2 Baths
1,736 Sq Ft
$110/Sq Ft Est. Value

Last Sold August 03, 2016

Last sale price $45,000 $26 Per Sq Ft

Est. 324% increase in value since last sale

Current estimated payment $1,262/month

About This Home

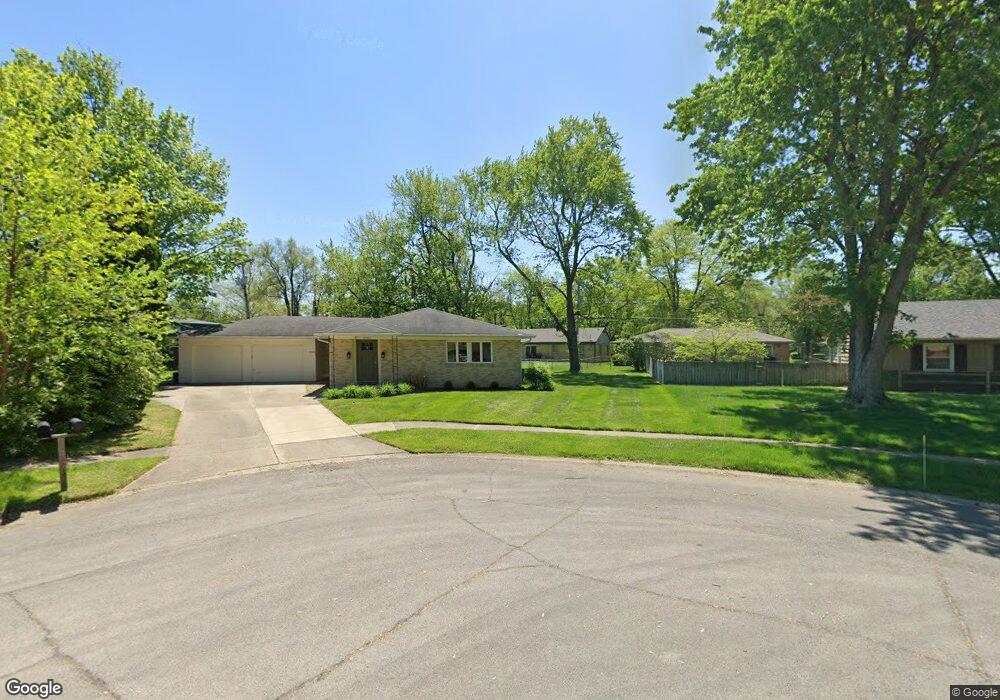
Plenty of potential exists within this property. Currently used as a rental, it could be purchased as such or used as a residence with potential for renting the other unit. There are 2 separate electrical meters, one for each unit, with shared water and sewer. The backyard is open and spacious with a partial fence. A breezeway from the driveway past the front unit provides easy access to the back unit. Plenty of windows provide natural light throughout. Located in desirable Halteman Village. Schedule your showing today so you don't miss out! Each unit features 868 sq. ft.

Ownership History

Date Name Owned For Owner Type

Purchase Details

Listed on
Jul 20, 2016
Closed on
Aug 3, 2016
Sold by
Deweese Thomas L
Bought by
Abbott Basil Llc
Seller's Agent
Ryan Kramer
RE/MAX Real Estate Groups
Buyer's Agent
Brian Allardt
Coldwell Banker Real Estate Group
List Price
$54,900
Sold Price
$45,000
Premium/Discount to List
-$9,900
-18.03%
Current Estimated Value
$190,873

Home Financials for this Owner

Home Financials are based on the most recent Mortgage that was taken out on this home.
Estimated Appreciation
$145,873
Avg. Annual Appreciation
16.81%
Source: Public Records

Range of Values:

Collateral Analytics

Collateral Analytics Collateral Analytics AVMs (Automated Valuation Model) employ a number of statistical approaches combined with neighborhood-specific comparable selection guarantees the most up-to-date and precise valuations.

Not Available

Collateral Analytics does not have data for the current month. Please view the chart for historical values.

ICE

ICE Mortgage Technology ICE Mortgage Technology’s AVM (Automated Valuation Model) is a state-of-the-art online residential property valuation tool that provides a quick and accurate estimate of the value of almost any home in the U.S.

Not Available

ICE Mortgage Technology does not have data for the current month. Please view the chart for historical values.

First American

First American First American Data & Analytics’ next-generation AVM combines unrivaled data assets with a blended ensemble of valuation models to produce highly accurate, reliable valuations you can trust.

Not Available

First American does not have data for the current month. Please view the chart for historical values.

Quantarium

Quantarium Quantarium’s valuation service, repeatedly proven the industry’s most accurate and comprehensive, is supercharged with a self-learning and auto-tuning AI engine that continually becomes smarter and more accurate as it processes daily inputs from the industry’s leading RE data lake.

Not Available

Quantarium does not have data for the current month. Please view the chart for historical values.

Average Value
Not Available
List Price
Sold Price
Create a Home Valuation Report for This Property
The Home Valuation Report is an in-depth analysis detailing your home's value as well as a comparison with similar homes in the area

Home Values in the Area

Source: Public Records

Average Home Value in this Area


Source: Public Records

Purchase History

Date Buyer Sale Price Title Company
Abbott Basil Llc -- --
Source: Public Records

Property History

Date Event Price List to Sale Price per Sq Ft Prior Sale
08/03/2016 08/03/16 Sold $45,000 -18.0% $26 / Sq Ft View Prior Sale
07/21/2016 07/21/16 Pending -- -- --
07/20/2016 07/20/16 For Sale $54,900 -- $32 / Sq Ft

Tax History Compared to Growth

Source: Public Records

Tax History

Year Tax Paid Tax Assessment Tax Assessment Total Assessment is a certain percentage of the fair market value that is determined by local assessors to be the total taxable value of land and additions on the property. Land Improvement
2024 $3,072 $147,700 $29,700 $118,000
2023 $3,072 $147,700 $29,700 $118,000
2022 $3,394 $163,800 $29,700 $134,100
2021 $2,886 $138,400 $22,800 $115,600
2020 $2,548 $121,500 $22,800 $98,700
2019 $2,494 $118,800 $20,700 $98,100
2018 $2,672 $127,700 $19,000 $108,700
2017 $2,568 $122,500 $19,300 $103,200
2016 $2,472 $117,700 $19,300 $98,400
2014 $2,555 $125,100 $20,300 $104,800
2013 -- $121,000 $20,300 $100,700
Source: Public Records

Agents Affiliated with this Home

  • Section Image
  • Section Image
See All Agents

Map