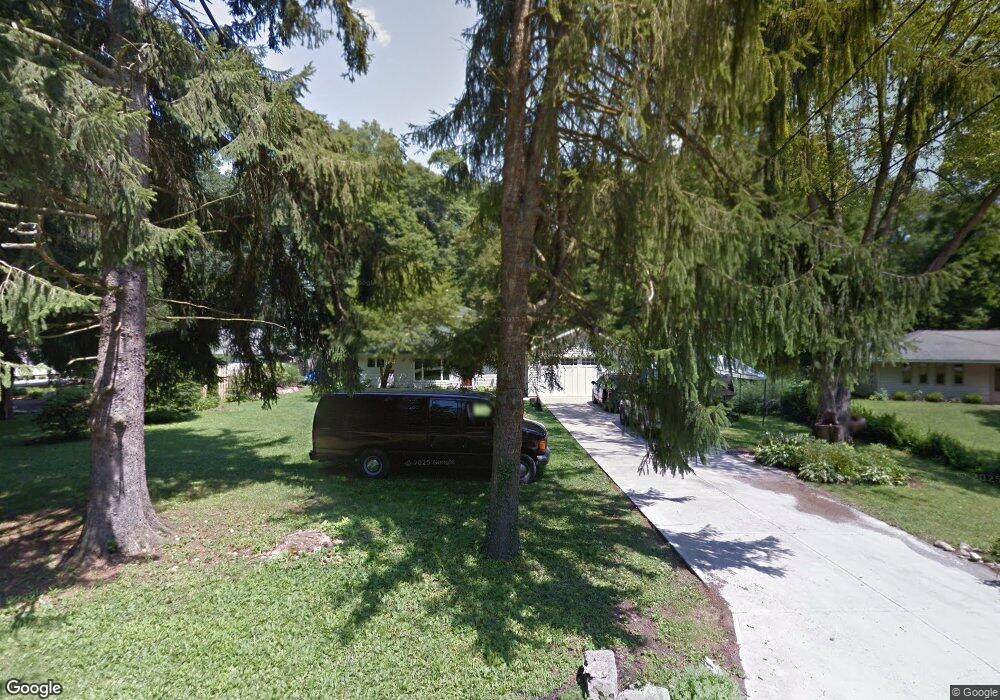
25016 Rainbow Dr Olmsted Falls, OH 44138
Estimated Value: $324,000 - $470,000
3
Beds
2
Baths
2,520
Sq Ft
$149/Sq Ft
Est. Value
About This Home
This home is located at 25016 Rainbow Dr, Olmsted Falls, OH 44138 and is currently estimated at $374,994, approximately $148 per square foot. 25016 Rainbow Dr is a home located in Cuyahoga County with nearby schools including Falls-Lenox Primary Elementary School, Olmsted Falls Intermediate Building, and Olmsted Falls Middle School.
Ownership History
Date
Name
Owned For
Owner Type
Purchase Details
Closed on
May 10, 2018
Sold by
Witteman Ruth Ann
Bought by
Witteman Mark P
Current Estimated Value
Purchase Details
Closed on
Jul 22, 2005
Sold by
Marini Valerie J
Bought by
Witteman Mark P
Purchase Details
Closed on
Jul 20, 2005
Sold by
Neumann Patricia M and Neumann Steven
Bought by
Witteman Mark P
Purchase Details
Closed on
Jul 18, 2005
Sold by
Witteman Carl P and Witteman Christine
Bought by
Witteman Mark P
Purchase Details
Closed on
Feb 2, 2005
Sold by
Estate Of Evelyn M Witteman
Bought by
Witteman Carl P and Witteman Mark P
Purchase Details
Closed on
Oct 18, 1983
Sold by
Witteman Carl J
Bought by
Witteman Evelyn
Purchase Details
Closed on
Jan 1, 1975
Bought by
Witteman Carl J
Create a Home Valuation Report for This Property
The Home Valuation Report is an in-depth analysis detailing your home's value as well as a comparison with similar homes in the area
Home Values in the Area
Average Home Value in this Area
Purchase History
| Date | Buyer | Sale Price | Title Company |
|---|---|---|---|
| Witteman Mark P | -- | None Available | |
| Witteman Mark P | -- | -- | |
| Witteman Mark P | -- | -- | |
| Witteman Mark P | -- | -- | |
| Witteman Carl P | -- | Attorney | |
| Witteman Evelyn | -- | -- | |
| Witteman Carl J | -- | -- |
Source: Public Records
Tax History Compared to Growth
Tax History
| Year | Tax Paid | Tax Assessment Tax Assessment Total Assessment is a certain percentage of the fair market value that is determined by local assessors to be the total taxable value of land and additions on the property. | Land | Improvement |
|---|---|---|---|---|
| 2024 | $7,107 | $98,280 | $5,145 | $93,135 |
| 2023 | $5,609 | $63,180 | $3,960 | $59,220 |
| 2022 | $5,608 | $63,180 | $3,960 | $59,220 |
| 2021 | $5,680 | $63,180 | $3,960 | $59,220 |
| 2020 | $5,266 | $53,100 | $3,330 | $49,770 |
| 2019 | $4,758 | $151,700 | $9,500 | $142,200 |
| 2018 | $4,540 | $53,100 | $3,330 | $49,770 |
| 2017 | $4,552 | $49,250 | $3,080 | $46,170 |
| 2016 | $4,638 | $49,250 | $3,080 | $46,170 |
| 2015 | $4,605 | $49,250 | $3,080 | $46,170 |
| 2014 | $4,605 | $49,250 | $3,080 | $46,170 |
Source: Public Records
Map
Nearby Homes
- 5668 Allendale Dr
- 25118 Carey Ln
- 5308 Columbia Rd
- 24300 Mastick Rd
- 24326 Mastick Rd
- 0 Mastick Rd Unit 5112571
- 0 V L Clareshire Dr
- 31 Vista Cir Unit A
- 8 Golf View Ln
- 385 Vista Cir
- 274 Vista Cir Unit B
- 25305 Country Club Blvd Unit 10
- 4849 Grace Rd Unit 121
- 7030 Columbia Rd
- 0 River Rd Unit 5169658
- 25735 Lorain Rd Unit 218
- 26902 Butternut Ridge Rd
- 55 Patio Ln
- VANDERBURGH Plan at Olmsted - Sanctuary of
- LYNDHURST Plan at Olmsted - Sanctuary of
- 25012 Rainbow Dr
- 25015 Rainbow Dr
- 25020 Rainbow Dr
- 25020 Rainbow Dr
- 25017 Rainbow Dr
- 25008 Rainbow Dr
- 25019 Rainbow Dr
- 25005 Rainbow Dr
- 25004 Rainbow Dr
- 25000 Rainbow Dr
- 25025 Rainbow Dr
- 25024 Rainbow Dr
- 5884 Lewis Rd
- 24000 Rainbow Dr
- 5876 Lewis Rd
- 0 Lewis Rd Unit 3803449
- 0 Lewis Rd Unit 660516
- 0 Lewis Rd Unit 4355272
- 25028 Rainbow Dr
- 5883 Lewis Rd