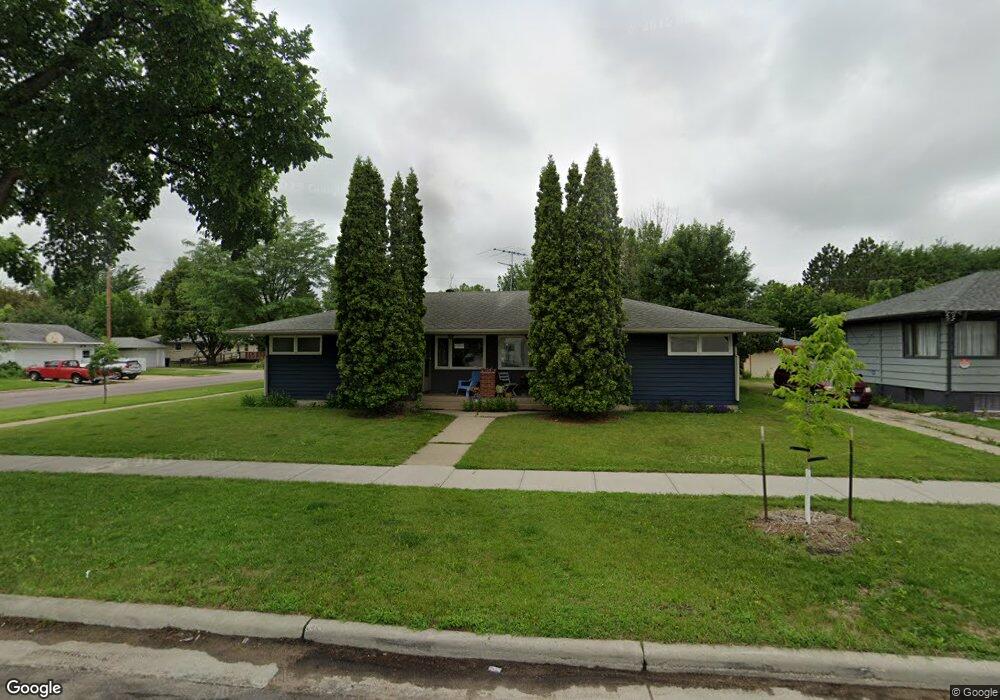
2502 8th St N Unit 2504 Fargo, ND 58102
Northport NeighborhoodEstimated Value: $237,000 - $306,000
--
Bed
2
Baths
1,862
Sq Ft
$138/Sq Ft
Est. Value
About This Home
This home is located at 2502 8th St N Unit 2504, Fargo, ND 58102 and is currently estimated at $256,667, approximately $137 per square foot. 2502 8th St N Unit 2504 is a home located in Cass County with nearby schools including McKinley Elementary School, Ben Franklin Middle School, and North High School.
Ownership History
Date
Name
Owned For
Owner Type
Purchase Details
Closed on
Nov 29, 2016
Sold by
Salvi Molly
Bought by
Antoine John M and Antoine Rachel H
Current Estimated Value
Purchase Details
Closed on
Jul 23, 2008
Sold by
Salvi Molly
Bought by
Salvi Molly
Create a Home Valuation Report for This Property
The Home Valuation Report is an in-depth analysis detailing your home's value as well as a comparison with similar homes in the area
Home Values in the Area
Average Home Value in this Area
Purchase History
| Date | Buyer | Sale Price | Title Company |
|---|---|---|---|
| Antoine John M | $175,000 | Fm Title Co | |
| Salvi Molly | -- | -- |
Source: Public Records
Tax History Compared to Growth
Tax History
| Year | Tax Paid | Tax Assessment Tax Assessment Total Assessment is a certain percentage of the fair market value that is determined by local assessors to be the total taxable value of land and additions on the property. | Land | Improvement |
|---|---|---|---|---|
| 2024 | $3,741 | $120,100 | $34,100 | $86,000 |
| 2023 | $3,755 | $120,100 | $34,100 | $86,000 |
| 2022 | $3,432 | $107,250 | $34,100 | $73,150 |
| 2021 | $3,062 | $95,350 | $34,100 | $61,250 |
| 2020 | $3,028 | $95,350 | $34,100 | $61,250 |
| 2019 | $2,990 | $95,350 | $18,950 | $76,400 |
| 2018 | $2,892 | $90,250 | $18,950 | $71,300 |
| 2017 | $2,349 | $87,600 | $18,950 | $68,650 |
| 2016 | $2,067 | $83,450 | $18,950 | $64,500 |
| 2015 | $2,201 | $83,450 | $14,200 | $69,250 |
| 2014 | $2,391 | $88,600 | $14,200 | $74,400 |
| 2013 | $2,396 | $88,600 | $14,200 | $74,400 |
Source: Public Records
Map
Nearby Homes
- 2510 10th St N
- 2214 9 1 2 St N
- 418 25th Ave N
- 310 27th Ave N
- 1914 9th St N
- 501 Forest Ave N Unit C
- 2902 3rd St N
- 2807 Edgewood Dr N
- 207 23rd Ave N
- 2512 2nd St N
- 305 19th Ave N
- 101 27th Ave N
- 3113 8th St N
- 1822 3rd St N
- 87 28th Ave N
- 3129 8th St N
- 314 18th Ave N
- 3216 Broadway N
- 111 19th Ave N
- 2926 Edgewood Dr N