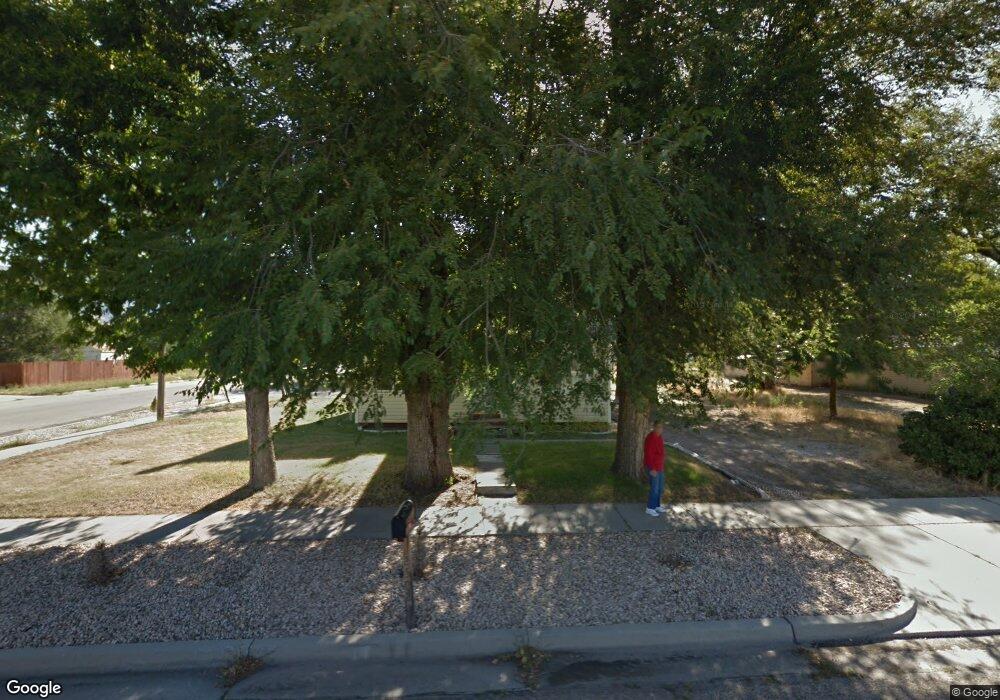
2502 B Ave Ogden, UT 84401
West Ogden NeighborhoodEstimated Value: $314,000 - $409,000
4
Beds
1
Bath
1,311
Sq Ft
$266/Sq Ft
Est. Value
About This Home
This home is located at 2502 B Ave, Ogden, UT 84401 and is currently estimated at $348,150, approximately $265 per square foot. 2502 B Ave is a home located in Weber County with nearby schools including Odyssey Elementary School, Mound Fort Junior High School, and Ben Lomond High School.
Ownership History
Date
Name
Owned For
Owner Type
Purchase Details
Closed on
Feb 9, 2026
Sold by
Iverson Timothy Jacob
Bought by
Iverson Timothy Jacob and Sweet Renae Madison
Current Estimated Value
Home Financials for this Owner
Home Financials are based on the most recent Mortgage that was taken out on this home.
Original Mortgage
$64,000
Outstanding Balance
$64,000
Interest Rate
6.15%
Mortgage Type
Credit Line Revolving
Estimated Equity
$284,150
Purchase Details
Closed on
Feb 25, 2022
Sold by
Dora Conde
Bought by
Iverson Timothy Jacob
Home Financials for this Owner
Home Financials are based on the most recent Mortgage that was taken out on this home.
Original Mortgage
$295,850
Interest Rate
3.92%
Mortgage Type
New Conventional
Purchase Details
Closed on
Jan 8, 2018
Sold by
Conde Dora
Bought by
Conde Dora
Home Financials for this Owner
Home Financials are based on the most recent Mortgage that was taken out on this home.
Original Mortgage
$105,000
Interest Rate
3.9%
Mortgage Type
New Conventional
Purchase Details
Closed on
Jul 14, 2000
Sold by
Cragun Les
Bought by
Conde Dora and Conde Serafin
Home Financials for this Owner
Home Financials are based on the most recent Mortgage that was taken out on this home.
Original Mortgage
$77,600
Interest Rate
8.55%
Mortgage Type
FHA
Create a Home Valuation Report for This Property
The Home Valuation Report is an in-depth analysis detailing your home's value as well as a comparison with similar homes in the area
Home Values in the Area
Average Home Value in this Area
Purchase History
| Date | Buyer | Sale Price | Title Company |
|---|---|---|---|
| Iverson Timothy Jacob | -- | Pioneer Title Agency | |
| Iverson Timothy Jacob | -- | Truly Title | |
| Conde Dora | -- | Benchmark Title Ins Agency | |
| Conde Dora | -- | First American Title |
Source: Public Records
Mortgage History
| Date | Status | Borrower | Loan Amount |
|---|---|---|---|
| Open | Iverson Timothy Jacob | $64,000 | |
| Previous Owner | Iverson Timothy Jacob | $295,850 | |
| Previous Owner | Conde Dora | $105,000 | |
| Previous Owner | Conde Dora | $77,600 |
Source: Public Records
Tax History
| Year | Tax Paid | Tax Assessment Tax Assessment Total Assessment is a certain percentage of the fair market value that is determined by local assessors to be the total taxable value of land and additions on the property. | Land | Improvement |
|---|---|---|---|---|
| 2025 | $1,937 | $283,927 | $90,400 | $193,527 |
| 2024 | $1,924 | $152,343 | $49,504 | $102,839 |
| 2023 | $2,001 | $159,480 | $49,219 | $110,261 |
| 2022 | $1,882 | $150,335 | $40,816 | $109,519 |
| 2021 | $1,712 | $227,002 | $38,394 | $188,608 |
| 2020 | $1,731 | $212,000 | $31,104 | $180,896 |
| 2019 | $1,807 | $207,837 | $25,997 | $181,840 |
| 2018 | $1,603 | $183,201 | $18,789 | $164,412 |
| 2017 | $1,088 | $116,167 | $15,842 | $100,325 |
| 2016 | $936 | $54,017 | $7,904 | $46,113 |
| 2015 | $792 | $44,619 | $9,490 | $35,129 |
| 2014 | $671 | $28,531 | $8,432 | $20,099 |
Source: Public Records
Map
Nearby Homes
- 527 24th St
- 769 W 24th St
- 768 W 24th St
- 313 E 750 S Unit 11
- 1987 S 4190 W Unit 107
- 3507 W 4000 S
- 2325 S 4600 W Unit 6
- 3682 W Richmond Dr Unit 223
- 325 E 750 S Unit 14
- 2730 W Rodeo Dr Unit 2
- 3644 W Collingwood Dr S Unit 202
- 3644 W Richmond Dr
- 4956 W 3200 S Unit 20
- 4192 W 1575 S Unit 202
- 4652 W 2330 S Unit 2
- 2671 S Monroe Blvd
- 3666 W Richmond Dr S Unit 224
- 2320 S 4600 W
- 1484 S 4125 W Unit 126
- 326 E 750 S Unit 9
Your Personal Tour Guide
Ask me questions while you tour the home.