
Landlord's Agent in 2018
Keith Towne
Keller Williams Premier Realty
(281) 507-5414
1 in this area
80 Total Sales
Estimated Value: $954,000 - $1,054,000
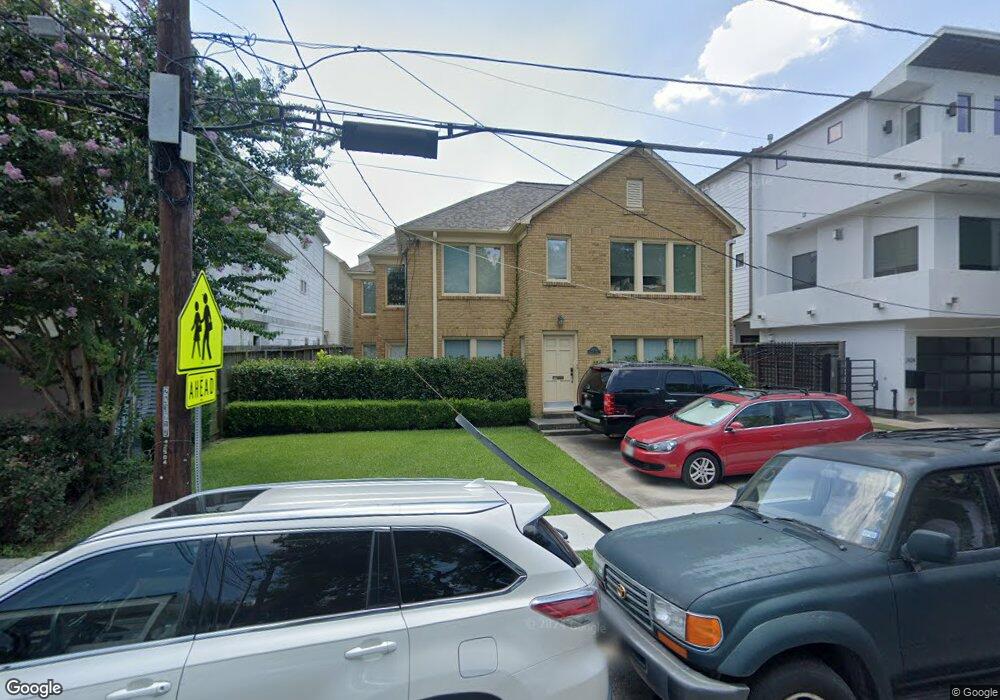
Gorgeous upper level flat in a perfect location! Nice hardwood floors with wide open spaces, generous sized rooms with central A/C and heat. Master bedroom has large study or flex room. Large open windows in Sunroom. This unit is spectacular and has two assigned off street parking spaces and nice shared back yard. Property available by Aug. 1st.
Last Agent to Rent the Property
Keller Williams Premier Realty License #0665310 Listed on: 06/16/2018
Last Renter's Agent
Keller Williams Premier Realty License #0665310 Listed on: 06/16/2018
| Date | Buyer | Sale Price | Title Company |
|---|---|---|---|
| Stonum Leah | -- | None Available | |
| Stonum Fon | -- | Ameripoint Title | |
| Rose Robert J | -- | American Title Co | |
| Heights Place Llc | -- | -- |
| Date | Status | Borrower | Loan Amount |
|---|---|---|---|
| Open | Stonum Fon | $262,500 | |
| Previous Owner | Rose Robert J | $225,000 | |
| Previous Owner | Heights Place Llc | $138,115 |
| Date | Event | Price | List to Sale | Price per Sq Ft |
|---|---|---|---|---|
| 12/30/2021 12/30/21 | Off Market | $1,975 | -- | -- |
| 07/25/2018 07/25/18 | Rented | $1,975 | -6.0% | -- |
| 06/25/2018 06/25/18 | Under Contract | -- | -- | -- |
| 06/16/2018 06/16/18 | For Rent | $2,100 | -- | -- |
| Year | Tax Paid | Tax Assessment Tax Assessment Total Assessment is a certain percentage of the fair market value that is determined by local assessors to be the total taxable value of land and additions on the property. | Land | Improvement |
|---|---|---|---|---|
| 2025 | $17,576 | $876,408 | $727,125 | $149,283 |
| 2024 | $17,576 | $840,000 | $727,125 | $112,875 |
| 2023 | $17,576 | $852,267 | $727,125 | $125,142 |
| 2022 | $17,340 | $787,500 | $639,870 | $147,630 |
| 2021 | $14,473 | $621,000 | $552,615 | $68,385 |
| 2020 | $16,425 | $678,295 | $513,808 | $164,487 |
| 2019 | $15,755 | $636,311 | $513,808 | $122,503 |
| 2018 | $11,213 | $566,000 | $443,497 | $122,503 |
| 2017 | $15,019 | $566,000 | $443,497 | $122,503 |
| 2016 | $15,019 | $566,000 | $443,497 | $122,503 |
| 2015 | $11,568 | $566,000 | $443,497 | $122,503 |
| 2014 | $11,568 | $450,000 | $367,778 | $82,222 |
Landlord's Agent in 2018
Keith Towne
Keller Williams Premier Realty
(281) 507-5414
1 in this area
80 Total Sales
Source: Houston Association of REALTORS®
MLS Number: 14761689
APN: 0291720060029
Disclaimer: Certain information contained herein is derived from information provided by parties other than Homes.com. All information provided is deemed reliable, but is not guaranteed to be accurate and should be independently verified.
![]() Copyright 2025, Houston REALTORS® Information Service, Inc.
Copyright 2025, Houston REALTORS® Information Service, Inc.
The information provided is exclusively for consumers’ personal, non-commercial use, and may not be used for any purpose other than to identify prospective properties consumers may be interested in purchasing.
Information is deemed reliable but not guaranteed.