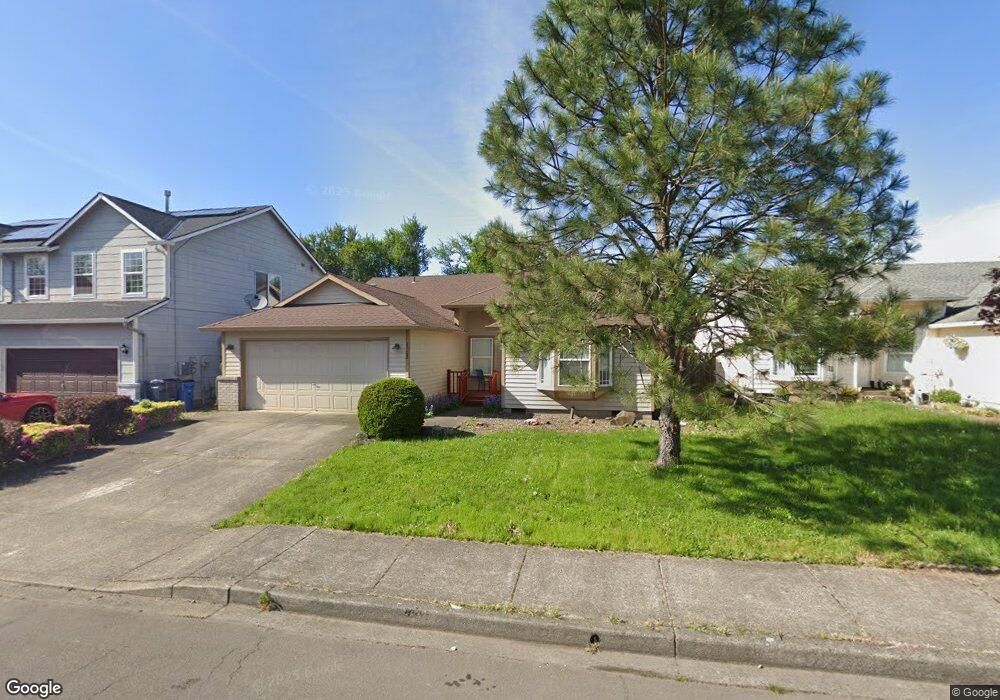
2502 SW 11th Cir Battle Ground, WA 98604
Estimated Value: $487,947 - $526,000
3
Beds
2
Baths
1,671
Sq Ft
$303/Sq Ft
Est. Value
About This Home
This home is located at 2502 SW 11th Cir, Battle Ground, WA 98604 and is currently estimated at $506,737, approximately $303 per square foot. 2502 SW 11th Cir is a home located in Clark County with nearby schools including Maple Grove Primary School, Prairie High School, and Firm Foundation Christian School.
Ownership History
Date
Name
Owned For
Owner Type
Purchase Details
Closed on
Feb 4, 2022
Sold by
Jeannie Lee
Bought by
20 20 Washington Llc
Current Estimated Value
Purchase Details
Closed on
May 24, 2009
Sold by
Laurie Norman J
Bought by
Creed William J
Home Financials for this Owner
Home Financials are based on the most recent Mortgage that was taken out on this home.
Original Mortgage
$147,000
Interest Rate
4.76%
Mortgage Type
Purchase Money Mortgage
Purchase Details
Closed on
Dec 6, 2005
Sold by
Bateman Derrick A and Bateman Heather L
Bought by
Laurie Sally P
Purchase Details
Closed on
May 18, 2000
Sold by
Kimball Hill Homes Washington Inc
Bought by
Bateman Derrick A and Bateman Heather L
Home Financials for this Owner
Home Financials are based on the most recent Mortgage that was taken out on this home.
Original Mortgage
$154,500
Interest Rate
8.08%
Mortgage Type
VA
Create a Home Valuation Report for This Property
The Home Valuation Report is an in-depth analysis detailing your home's value as well as a comparison with similar homes in the area
Home Values in the Area
Average Home Value in this Area
Purchase History
| Date | Buyer | Sale Price | Title Company |
|---|---|---|---|
| 20 20 Washington Llc | $313 | Fidelity Title | |
| Lee Jeannie | $313 | Fidelity Title | |
| Creed William J | $210,000 | Clark County Title Co | |
| Laurie Sally P | $265,000 | Cascade Title | |
| Bateman Derrick A | $150,000 | Chicago Title Insurance Co |
Source: Public Records
Mortgage History
| Date | Status | Borrower | Loan Amount |
|---|---|---|---|
| Previous Owner | Creed William J | $147,000 | |
| Previous Owner | Bateman Derrick A | $154,500 |
Source: Public Records
Tax History Compared to Growth
Tax History
| Year | Tax Paid | Tax Assessment Tax Assessment Total Assessment is a certain percentage of the fair market value that is determined by local assessors to be the total taxable value of land and additions on the property. | Land | Improvement |
|---|---|---|---|---|
| 2025 | $3,919 | $464,730 | $155,000 | $309,730 |
| 2024 | $3,261 | $481,776 | $155,000 | $326,776 |
| 2023 | $3,529 | $456,137 | $155,000 | $301,137 |
| 2022 | $3,430 | $450,093 | $131,750 | $318,343 |
| 2021 | $3,433 | $380,115 | $106,250 | $273,865 |
| 2020 | $2,876 | $348,968 | $97,750 | $251,218 |
| 2019 | $2,388 | $331,437 | $100,300 | $231,137 |
| 2018 | $2,940 | $322,187 | $0 | $0 |
| 2017 | $2,421 | $291,253 | $0 | $0 |
| 2016 | $2,453 | $261,310 | $0 | $0 |
| 2015 | $2,396 | $242,897 | $0 | $0 |
| 2014 | -- | $225,138 | $0 | $0 |
| 2013 | -- | $199,727 | $0 | $0 |
Source: Public Records
Map
Nearby Homes
- 1019 SW 27th Ct
- 2507 SW 5th Way
- 2307 SW 5th Cir
- 2301 SW 5th Cir
- 2111 SW 5th St
- 20204 NE 104th Ave
- 1816 SW 6th St
- 2514 W Main St
- 1513 SW 6th St
- 1512 SW 5th St
- 502 SW 15th Ave
- 10400 NE 197th St
- 0 W Main St Unit 793373106
- 0 W Main St Unit 261126278
- 1807 NW 3rd St
- 344 NW 29th Way
- 0 NW 2nd St Unit 2 & 3 780233409
- 0 NW 2nd St Unit 3 282019710
- 0 NW 2nd St Unit 2 167106682
- 1608 NW 3rd St
- 2504 SW 11th Cir
- 2410 SW 11th Cir
- 2406 SW 11th Cir
- 1002 SW 24th Ave
- 2501 SW 11th Cir
- 1000 SW 24th Ave
- 2510 SW 11th Cir
- 2409 SW 11th Cir
- 2407 SW 11th Cir
- 2505 SW 11th Cir
- 906 SW 24th Ave
- 2308 SW 11th Cir
- 2309 SW 10th St
- 2512 SW 11th Cir
- 904 SW 24th Ave
- 2309 SW 11th Cir
- 2307 SW 10th St
- 2307 SW 11th Cir
- 2308 SW 10th St
- 902 SW 24th Ave