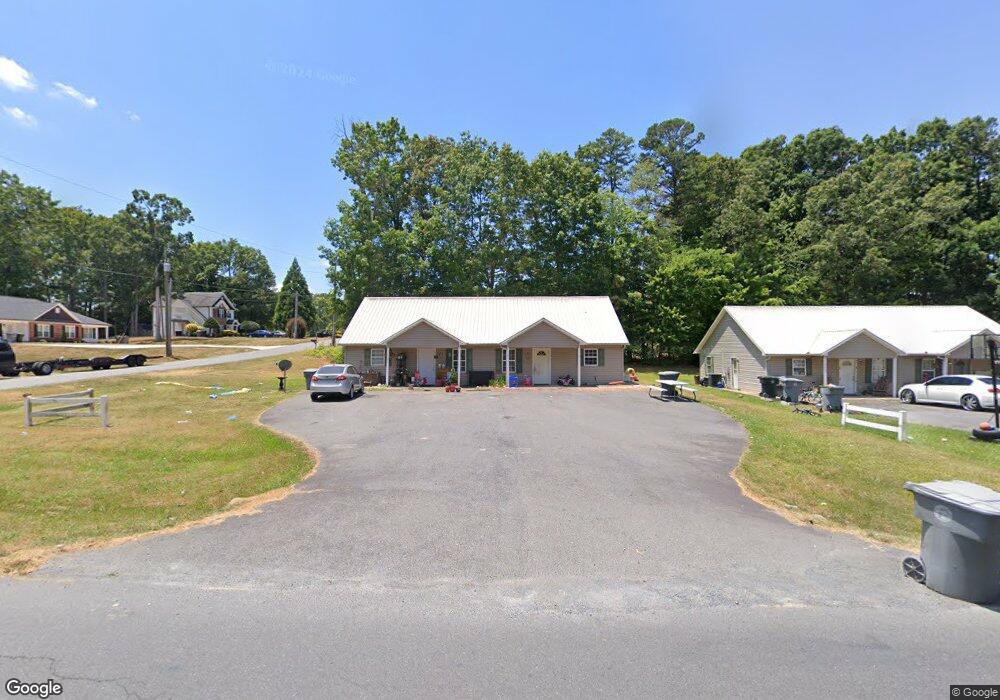
2503 Bank St Asheboro, NC 27203
Estimated Value: $183,000 - $373,000
--
Bed
4
Baths
3,500
Sq Ft
$78/Sq Ft
Est. Value
About This Home
This home is located at 2503 Bank St, Asheboro, NC 27203 and is currently estimated at $274,364, approximately $78 per square foot. 2503 Bank St is a home located in Randolph County with nearby schools including Randleman Elementary School, Randleman Middle School, and Randleman High School.
Ownership History
Date
Name
Owned For
Owner Type
Purchase Details
Closed on
Jul 28, 2025
Sold by
Frank J Taylor Revocable Living Trust and Taylor Donna K
Bought by
Donna Kay Pathe Living Trust and Taylor
Current Estimated Value
Purchase Details
Closed on
Oct 23, 2019
Sold by
Taylor Donna K Pathe
Bought by
Taylor Donna K Pathe and Donna Kay Pathe Living Trust
Purchase Details
Closed on
Jan 16, 2019
Sold by
Pathe Donna and Taylor Frank J
Bought by
Taylor Frank J and The Frank J Taylor Revocable Living Trus
Purchase Details
Closed on
Jan 4, 2019
Sold by
Taylor Frank J
Bought by
Taylor Frank J and The Frank J Taylor Revocable Living Trus
Purchase Details
Closed on
Oct 12, 2015
Sold by
Bennett Ronald L and Bennett Sharon H
Bought by
Taylor Frank James
Purchase Details
Closed on
Oct 10, 2000
Bought by
Bennett Ronald L Bennett Others
Create a Home Valuation Report for This Property
The Home Valuation Report is an in-depth analysis detailing your home's value as well as a comparison with similar homes in the area
Home Values in the Area
Average Home Value in this Area
Purchase History
| Date | Buyer | Sale Price | Title Company |
|---|---|---|---|
| Donna Kay Pathe Living Trust | -- | None Listed On Document | |
| Taylor Donna K Pathe | -- | None Available | |
| Taylor Frank J | -- | None Available | |
| Taylor Frank J | -- | None Available | |
| Taylor Frank James | $180,000 | None Available | |
| Bennett Ronald L Bennett Others | $201,000 | -- |
Source: Public Records
Tax History Compared to Growth
Tax History
| Year | Tax Paid | Tax Assessment Tax Assessment Total Assessment is a certain percentage of the fair market value that is determined by local assessors to be the total taxable value of land and additions on the property. | Land | Improvement |
|---|---|---|---|---|
| 2025 | $3,727 | $269,350 | $26,770 | $242,580 |
| 2024 | $3,727 | $269,350 | $26,770 | $242,580 |
| 2023 | $3,727 | $269,350 | $26,770 | $242,580 |
| 2022 | $2,496 | $192,360 | $24,680 | $167,680 |
| 2021 | $2,496 | $192,360 | $24,680 | $167,680 |
| 2020 | $2,496 | $192,360 | $24,680 | $167,680 |
| 2019 | $2,496 | $192,360 | $24,680 | $167,680 |
| 2018 | $2,400 | $182,130 | $34,030 | $148,100 |
| 2016 | $2,400 | $182,138 | $34,030 | $148,108 |
| 2015 | $2,404 | $182,138 | $34,030 | $148,108 |
| 2014 | -- | $182,138 | $34,030 | $148,108 |
Source: Public Records
Map
Nearby Homes
- 240 Landis Ct Unit 10
- 2539 Windstone Ct
- 2339 Hickory Forest Dr
- 2922 Mimosa Ct
- 2931 Reginas Way
- 165 Homeplace Dr
- 140 Old Heritage Rd
- 130 Old Heritage Rd
- 503 Sunrise Ave
- 1847 Saddlewood Ct
- 2403 Regency Dr
- 226 Sheffield Ave
- 1822 Newell St
- 1121 Hub Morris Rd
- 911 Old Liberty Rd
- 1807 Newell St
- 1223 Old Liberty Rd
- 1226 Old Liberty Rd
- 1907 Levance St
- 1913 Levance St