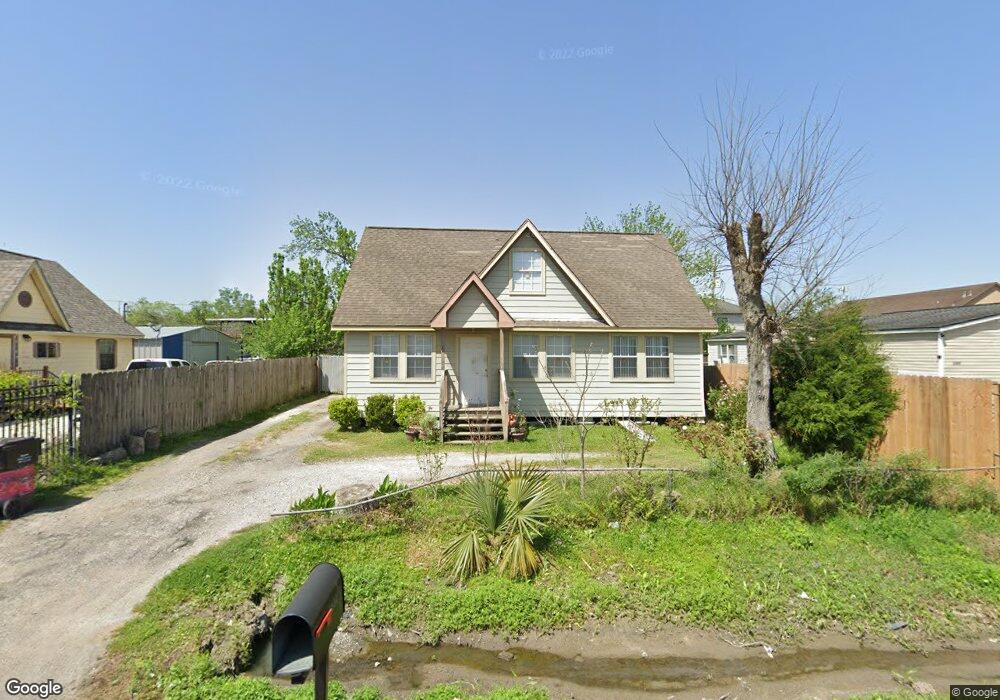
2503 Cromwell St Houston, TX 77093
East Aldine NeighborhoodEstimated Value: $179,000 - $215,000
4
Beds
2
Baths
1,600
Sq Ft
$122/Sq Ft
Est. Value
About This Home
This home is located at 2503 Cromwell St, Houston, TX 77093 and is currently estimated at $195,156, approximately $121 per square foot. 2503 Cromwell St is a home located in Harris County with nearby schools including Scarborough Elementary School, Patrick Henry Middle School, and Sam Houston Math, Science & Technology Center.
Ownership History
Date
Name
Owned For
Owner Type
Purchase Details
Closed on
Sep 13, 2007
Sold by
Bank Of New York
Bought by
Trejo Juan Carlos
Current Estimated Value
Home Financials for this Owner
Home Financials are based on the most recent Mortgage that was taken out on this home.
Original Mortgage
$74,050
Outstanding Balance
$46,835
Interest Rate
6.55%
Mortgage Type
Purchase Money Mortgage
Estimated Equity
$148,321
Purchase Details
Closed on
Apr 3, 2007
Sold by
Rodriguez Juan
Bought by
Bank Of New York and Certificateholders Cwabs Inc Asset Backe
Purchase Details
Closed on
Feb 15, 2004
Sold by
Garcia Jesus and Garcia Leonarda Leticia
Bought by
Ruan Martin and Ruan Paula
Purchase Details
Closed on
Dec 10, 2001
Sold by
Ruan Paula and Ruan Martin
Bought by
Garcia Jesus and Garcia Leonarda Leticia
Home Financials for this Owner
Home Financials are based on the most recent Mortgage that was taken out on this home.
Original Mortgage
$68,773
Interest Rate
6.87%
Create a Home Valuation Report for This Property
The Home Valuation Report is an in-depth analysis detailing your home's value as well as a comparison with similar homes in the area
Home Values in the Area
Average Home Value in this Area
Purchase History
| Date | Buyer | Sale Price | Title Company |
|---|---|---|---|
| Trejo Juan Carlos | -- | United Title Of Texas | |
| Bank Of New York | $77,400 | None Available | |
| Ruan Martin | -- | -- | |
| Garcia Jesus | -- | American Title Co |
Source: Public Records
Mortgage History
| Date | Status | Borrower | Loan Amount |
|---|---|---|---|
| Open | Trejo Juan Carlos | $74,050 | |
| Previous Owner | Garcia Jesus | $68,773 |
Source: Public Records
Tax History Compared to Growth
Tax History
| Year | Tax Paid | Tax Assessment Tax Assessment Total Assessment is a certain percentage of the fair market value that is determined by local assessors to be the total taxable value of land and additions on the property. | Land | Improvement |
|---|---|---|---|---|
| 2025 | $3,094 | $174,551 | $63,090 | $111,461 |
| 2024 | $3,094 | $176,035 | $63,090 | $112,945 |
| 2023 | $3,094 | $194,311 | $63,090 | $131,221 |
| 2022 | $2,897 | $155,819 | $43,813 | $112,006 |
| 2021 | $2,637 | $133,558 | $43,813 | $89,745 |
| 2020 | $2,559 | $124,602 | $33,999 | $90,603 |
| 2019 | $3,151 | $147,095 | $33,999 | $113,096 |
| 2018 | $1,764 | $82,353 | $30,844 | $51,509 |
| 2017 | $1,764 | $82,353 | $30,844 | $51,509 |
| 2016 | $1,764 | $82,353 | $30,844 | $51,509 |
| 2015 | $1,442 | $67,403 | $19,278 | $48,125 |
| 2014 | $1,442 | $67,403 | $19,278 | $48,125 |
Source: Public Records
Map
Nearby Homes
- 2311 Warwick Rd
- 2237 Cromwell St
- 2629 Kowis St
- 2817 Cromwell St
- 2326 Sunny Dr
- 2152 William Tell St
- 2306 Wardmont St
- 2636 Lone Oak Rd
- 2122 Kowis St
- 2131 Cromwell St Unit D
- 11716 Innsbury Dr
- 11746 Somerset Ln
- 2131 Warwick Rd
- 2123 Warwick Rd
- 2915 Brea Crest St
- 1930 Cromwell St
- 1728 Little York Rd
- 1925 Sunny Dr
- 2723 Castledale Dr
- 3214 Brea Crest St
- 2503 Cromwell St
- 2435 Cromwell St
- 2438 Cromwell St
- 2425 Cromwell St
- 2430 Warwick Rd
- 2434 Cromwell St
- 2506 Warwick Rd
- 2502 Cromwell St
- 2428 Warwick Rd
- 2510 Warwick Rd
- 2510 Cromwell St
- 2421 Cromwell St
- 2426 Warwick Rd
- 2517 Cromwell St
- 2514 Cromwell St
- 2422 Warwick Rd
- 2417 Cromwell St
- 2518 Cromwell St
- 2521 Cromwell St
- 2439 Chamberlain St