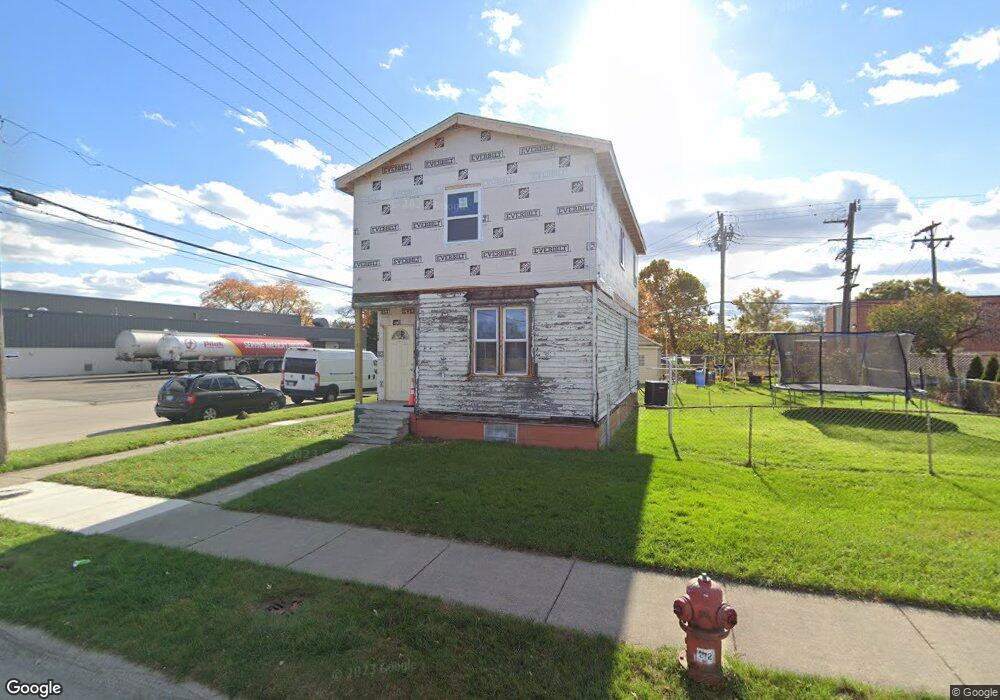
2503 Emily St Melvindale, MI 48122
Estimated Value: $107,000 - $126,000
3
Beds
2
Baths
1,083
Sq Ft
$107/Sq Ft
Est. Value
About This Home
This home is located at 2503 Emily St, Melvindale, MI 48122 and is currently estimated at $116,241, approximately $107 per square foot. 2503 Emily St is a home located in Wayne County with nearby schools including Rogers Early Elementary School, Allendale Elementary School, and Julian O. Strong Middle School.
Ownership History
Date
Name
Owned For
Owner Type
Purchase Details
Closed on
Aug 16, 2014
Sold by
Jones Jennifer
Bought by
Al Katabi Mohamed
Current Estimated Value
Purchase Details
Closed on
Dec 31, 2010
Sold by
Residential Credit Solutions Inc
Bought by
Federal National Mortgage Association
Purchase Details
Closed on
Dec 9, 2010
Sold by
Kang Chaudhry M and Kang Ghulam F
Bought by
Residential Credit Solutions Inc
Purchase Details
Closed on
Aug 19, 2003
Sold by
Hud
Bought by
Kang Chaudhry
Create a Home Valuation Report for This Property
The Home Valuation Report is an in-depth analysis detailing your home's value as well as a comparison with similar homes in the area
Home Values in the Area
Average Home Value in this Area
Purchase History
| Date | Buyer | Sale Price | Title Company |
|---|---|---|---|
| Al Katabi Mohamed | -- | None Available | |
| Federal National Mortgage Association | -- | None Available | |
| Residential Credit Solutions Inc | $54,331 | None Available | |
| Kang Chaudhry | $73,452 | -- |
Source: Public Records
Tax History Compared to Growth
Tax History
| Year | Tax Paid | Tax Assessment Tax Assessment Total Assessment is a certain percentage of the fair market value that is determined by local assessors to be the total taxable value of land and additions on the property. | Land | Improvement |
|---|---|---|---|---|
| 2025 | $956 | $50,700 | $0 | $0 |
| 2024 | $956 | $42,400 | $0 | $0 |
| 2023 | $911 | $40,800 | $0 | $0 |
| 2022 | $1,770 | $36,800 | $0 | $0 |
| 2021 | $1,716 | $32,100 | $0 | $0 |
| 2020 | $1,710 | $25,500 | $0 | $0 |
| 2019 | $1,585 | $24,400 | $0 | $0 |
| 2018 | $947 | $24,500 | $0 | $0 |
| 2017 | $1,176 | $25,000 | $0 | $0 |
| 2016 | $1,502 | $24,000 | $0 | $0 |
| 2015 | $2,180 | $21,800 | $0 | $0 |
| 2013 | $2,120 | $22,200 | $0 | $0 |
| 2012 | $2,081 | $21,700 | $2,200 | $19,500 |
Source: Public Records
Map
Nearby Homes