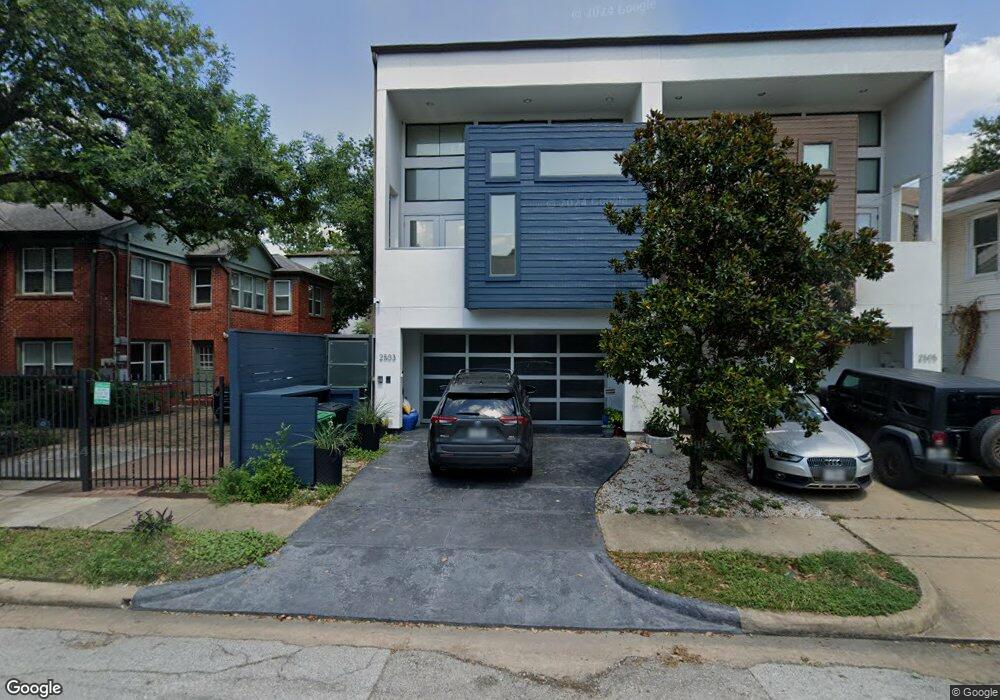
2503 Hazard St Houston, TX 77019
Montrose NeighborhoodEstimated Value: $786,000 - $1,409,000
3
Beds
4
Baths
3,251
Sq Ft
$305/Sq Ft
Est. Value
About This Home
This home is located at 2503 Hazard St, Houston, TX 77019 and is currently estimated at $992,614, approximately $305 per square foot. 2503 Hazard St is a home located in Harris County with nearby schools including Baker Montessori, Lanier Middle School, and Lamar High School.
Ownership History
Date
Name
Owned For
Owner Type
Purchase Details
Closed on
Feb 24, 2014
Sold by
Hirsch Calley and Hirsch Cory
Bought by
Kaled Elizabeth S and Gutterman Jordan U
Current Estimated Value
Purchase Details
Closed on
Dec 17, 2008
Sold by
On Point Development Lp
Bought by
Hirsch Cory
Home Financials for this Owner
Home Financials are based on the most recent Mortgage that was taken out on this home.
Original Mortgage
$417,000
Interest Rate
6.19%
Mortgage Type
Purchase Money Mortgage
Purchase Details
Closed on
Feb 20, 2008
Sold by
I A N Lp
Bought by
On Point Development Lp
Home Financials for this Owner
Home Financials are based on the most recent Mortgage that was taken out on this home.
Original Mortgage
$2,500,000
Interest Rate
5.88%
Mortgage Type
Purchase Money Mortgage
Create a Home Valuation Report for This Property
The Home Valuation Report is an in-depth analysis detailing your home's value as well as a comparison with similar homes in the area
Home Values in the Area
Average Home Value in this Area
Purchase History
| Date | Buyer | Sale Price | Title Company |
|---|---|---|---|
| Kaled Elizabeth S | -- | -- | |
| Kaled Elizabeth S | -- | -- | |
| Hirsch Cory | -- | Frontier Title Co Wh Llc | |
| On Point Development Lp | -- | Frontier Title Company |
Source: Public Records
Mortgage History
| Date | Status | Borrower | Loan Amount |
|---|---|---|---|
| Previous Owner | Hirsch Cory | $417,000 | |
| Previous Owner | On Point Development Lp | $2,500,000 |
Source: Public Records
Tax History Compared to Growth
Tax History
| Year | Tax Paid | Tax Assessment Tax Assessment Total Assessment is a certain percentage of the fair market value that is determined by local assessors to be the total taxable value of land and additions on the property. | Land | Improvement |
|---|---|---|---|---|
| 2025 | $9,231 | $895,513 | $275,000 | $620,513 |
| 2024 | $9,231 | $823,469 | $275,000 | $548,469 |
| 2023 | $9,231 | $830,158 | $275,000 | $555,158 |
| 2022 | $16,707 | $758,752 | $275,000 | $483,752 |
| 2021 | $16,756 | $718,929 | $262,500 | $456,429 |
| 2020 | $17,505 | $722,870 | $262,500 | $460,370 |
| 2019 | $18,555 | $733,258 | $150,000 | $583,258 |
| 2018 | $13,409 | $787,877 | $150,000 | $637,877 |
| 2017 | $20,907 | $787,877 | $150,000 | $637,877 |
| 2016 | $20,907 | $787,877 | $150,000 | $637,877 |
| 2015 | $17,866 | $787,877 | $150,000 | $637,877 |
| 2014 | $17,866 | $695,000 | $131,250 | $563,750 |
Source: Public Records
Map
Nearby Homes
- 2505 Mcduffie St Unit B
- 2309 Driscoll St
- 1900 Hawthorne St
- 2508 Brun St
- 2415 Elmen St
- 2315 Huldy St
- 2103 Hazard St
- 2112 Mcduffie St
- 2410 Huldy St
- 2314 Park St
- 1912 Kipling St
- 1924 Kipling St
- 2119 Huldy St
- 2026 Morse St
- 2117 Huldy St
- 2115 Huldy St
- 2113 Huldy St
- 2008 Hazard St
- 1755 Kipling St
- 1824 Marshall St
- 2505 Hazard St
- 2505 Hazard St Unit B
- 2501 Hazard St
- 2501 Hazard St Unit 2
- 2501 Hazard St Unit 1
- 2513 Hazard St
- 2510 Driscoll St
- 2506 Driscoll St Unit 1
- 2506 Driscoll St Unit 4
- 2506 Driscoll St
- 2427 Hazard St Unit 4
- 2427 Hazard St Unit 1
- 2427 Hazard St Unit 2
- 2515 Hazard St
- 2504 Driscoll St
- 2514 Driscoll St
- 2514 Driscoll St
- 2423 Hazard St
- 2502 Driscoll St
- 2502 Driscoll St Unit A