2503 Mallard Ct Keller, TX 76248
Hidden Lakes NeighborhoodEstimated Value: $551,505 - $592,000
4
Beds
2
Baths
2,300
Sq Ft
$247/Sq Ft
Est. Value
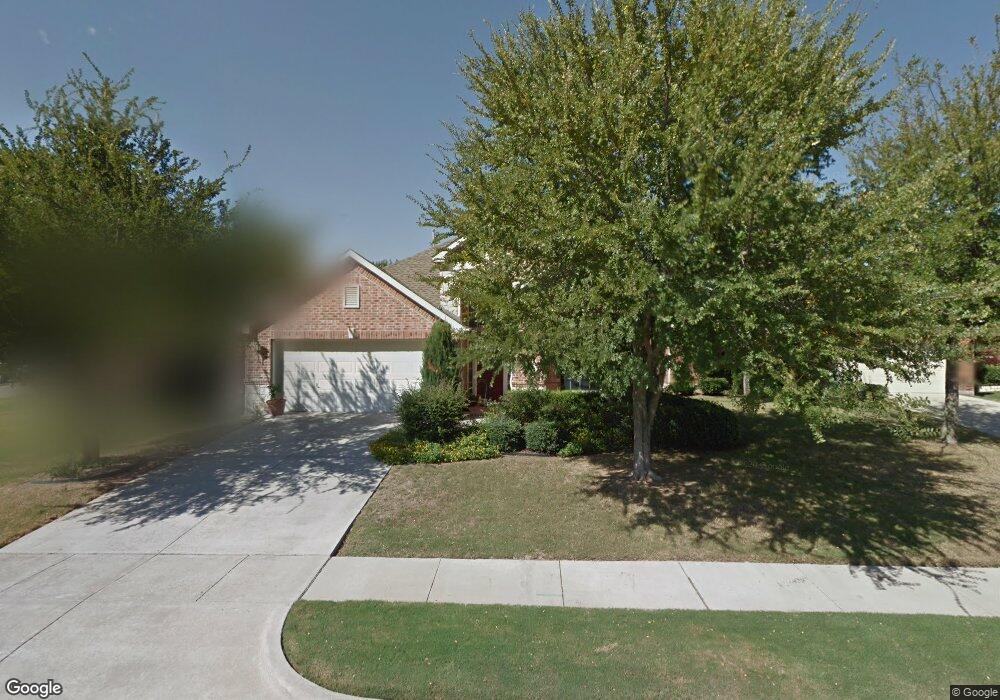
About This Home
This home is located at 2503 Mallard Ct, Keller, TX 76248 and is currently estimated at $568,626, approximately $247 per square foot. 2503 Mallard Ct is a home located in Tarrant County with nearby schools including Hidden Lakes Elementary School, Bear Creek Intermediate School, and Keller Middle School.
Ownership History
Date
Name
Owned For
Owner Type
Purchase Details
Closed on
Jun 8, 2021
Sold by
Hillmer Christy M
Bought by
Mcafee Logan and Mcafee Tara
Current Estimated Value
Home Financials for this Owner
Home Financials are based on the most recent Mortgage that was taken out on this home.
Original Mortgage
$320,000
Outstanding Balance
$289,720
Interest Rate
2.9%
Mortgage Type
New Conventional
Estimated Equity
$278,906
Purchase Details
Closed on
Apr 12, 2007
Sold by
Fairbrook Matthew L and Fairbrook Teresa A
Bought by
Hillmer Christy M
Home Financials for this Owner
Home Financials are based on the most recent Mortgage that was taken out on this home.
Original Mortgage
$175,000
Interest Rate
6.1%
Mortgage Type
Purchase Money Mortgage
Purchase Details
Closed on
Mar 28, 2002
Sold by
Engle Homes/Texas Inc
Bought by
Fairbrook Matthew L and Fairbrook Teresa A
Home Financials for this Owner
Home Financials are based on the most recent Mortgage that was taken out on this home.
Original Mortgage
$169,750
Interest Rate
6.78%
Create a Home Valuation Report for This Property
The Home Valuation Report is an in-depth analysis detailing your home's value as well as a comparison with similar homes in the area
Home Values in the Area
Average Home Value in this Area
Purchase History
| Date | Buyer | Sale Price | Title Company |
|---|---|---|---|
| Mcafee Logan | -- | Old Republic Title | |
| Hillmer Christy M | -- | Hexter Fair Title Company | |
| Fairbrook Matthew L | -- | Universal Land Title |
Source: Public Records
Mortgage History
| Date | Status | Borrower | Loan Amount |
|---|---|---|---|
| Open | Mcafee Logan | $320,000 | |
| Previous Owner | Hillmer Christy M | $175,000 | |
| Previous Owner | Fairbrook Matthew L | $169,750 |
Source: Public Records
Tax History Compared to Growth
Tax History
| Year | Tax Paid | Tax Assessment Tax Assessment Total Assessment is a certain percentage of the fair market value that is determined by local assessors to be the total taxable value of land and additions on the property. | Land | Improvement |
|---|---|---|---|---|
| 2025 | $7,265 | -- | -- | -- |
| 2024 | $7,265 | $485,000 | $62,262 | $422,738 |
| 2023 | $8,363 | $521,378 | $100,000 | $421,378 |
| 2022 | $8,824 | $400,000 | $80,000 | $320,000 |
| 2021 | $8,098 | $340,492 | $80,000 | $260,492 |
| 2020 | $8,191 | $341,736 | $80,000 | $261,736 |
| 2019 | $8,364 | $332,186 | $80,000 | $252,186 |
| 2018 | $7,579 | $320,223 | $80,000 | $240,223 |
| 2017 | $8,112 | $317,881 | $80,000 | $237,881 |
| 2016 | $7,375 | $299,634 | $70,000 | $229,634 |
| 2015 | $6,366 | $260,200 | $35,000 | $225,200 |
| 2014 | $6,366 | $260,200 | $35,000 | $225,200 |
Source: Public Records
Map
Nearby Homes
- 2311 Watercrest Dr
- 528 Sorenson Trail
- 2499 Union Church Rd
- 503 Sorenson Trail
- 3004 Veranda Ln
- 2728 Edgebrook Ct
- 540 Michener Ct
- 2410 Brushcreek Dr
- 606 Eagle Ct
- 301 Watermere Dr Unit 401
- 301 Watermere Dr Unit 216
- 715 Misty Ct
- 508 Hidden Meadow Dr
- 9204 Indian Knoll Trail
- 2620 Park Grove Loop
- 2616 Park Grove Loop
- 1005 Siena Dr
- 351 Watermere Dr
- 2636 Park Grove Loop
- 2401 Lower Brook Ct
- 2505 Mallard Ct
- 2501 Mallard Ct
- 2507 Mallard Ct
- 2504 Drake Ct
- 2506 Drake Ct
- 2502 Drake Ct
- 2508 Drake Ct
- 2500 Drake Ct
- 2500 Mallard Ct
- 526 Arcadia Dr
- 516 Ironwood Dr
- 2502 Mallard Ct
- 524 Arcadia Dr
- 530 Arcadia Dr
- 2504 Mallard Ct
- 2600 Wildcreek Trail
- 514 Ironwood Dr
- 532 Arcadia Dr
- 522 Arcadia Dr
- 2602 Wildcreek Trail