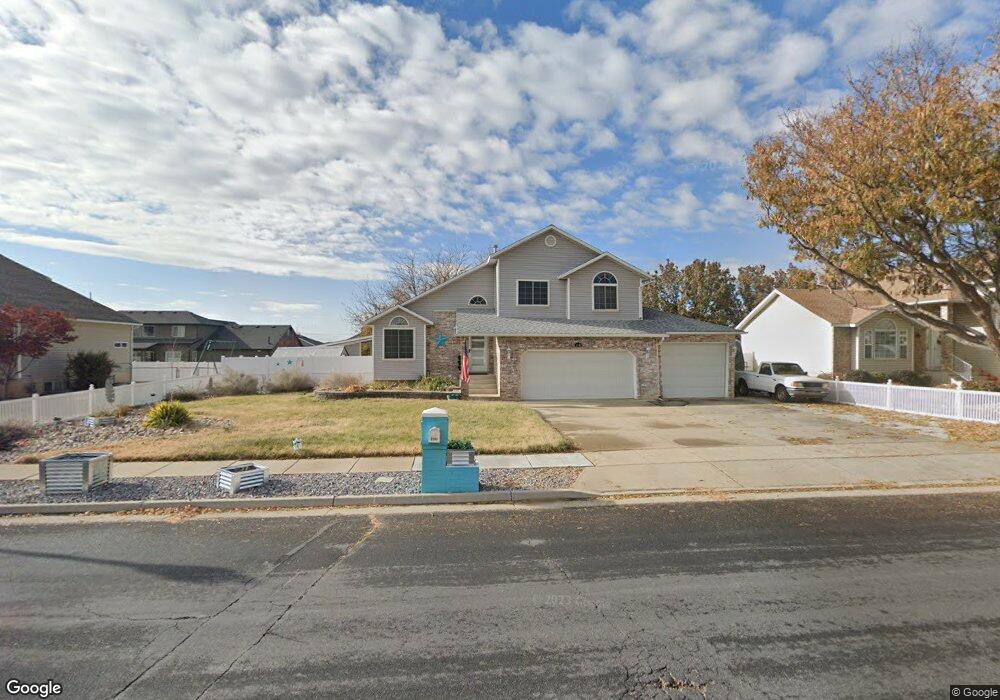
2503 N 1220 W Clearfield, UT 84015
Estimated Value: $470,000 - $554,000
4
Beds
3
Baths
2,236
Sq Ft
$229/Sq Ft
Est. Value
About This Home
This home is located at 2503 N 1220 W, Clearfield, UT 84015 and is currently estimated at $511,516, approximately $228 per square foot. 2503 N 1220 W is a home located in Davis County with nearby schools including Parkside Elementary School, Sunset Junior High School, and Clearfield High School.
Ownership History
Date
Name
Owned For
Owner Type
Purchase Details
Closed on
Sep 22, 2017
Sold by
Shirley Ryan A and Shirley Daniell
Bought by
Coleman Edward and Coleman Julia
Current Estimated Value
Purchase Details
Closed on
May 13, 2016
Sold by
Shirley Ryan A
Bought by
Shirley Ryan A and Shirley Deniell
Purchase Details
Closed on
Feb 28, 2013
Sold by
Fast Steven E and Fast Monika K
Bought by
Shirley Ryan A
Home Financials for this Owner
Home Financials are based on the most recent Mortgage that was taken out on this home.
Original Mortgage
$195,000
Interest Rate
3.34%
Mortgage Type
VA
Create a Home Valuation Report for This Property
The Home Valuation Report is an in-depth analysis detailing your home's value as well as a comparison with similar homes in the area
Home Values in the Area
Average Home Value in this Area
Purchase History
| Date | Buyer | Sale Price | Title Company |
|---|---|---|---|
| Coleman Edward | -- | -- | |
| Shirley Ryan A | -- | Hickman Land Title | |
| Shirley Ryan A | -- | Lincoln Title Insurance Agen |
Source: Public Records
Mortgage History
| Date | Status | Borrower | Loan Amount |
|---|---|---|---|
| Previous Owner | Shirley Ryan A | $195,000 |
Source: Public Records
Tax History Compared to Growth
Tax History
| Year | Tax Paid | Tax Assessment Tax Assessment Total Assessment is a certain percentage of the fair market value that is determined by local assessors to be the total taxable value of land and additions on the property. | Land | Improvement |
|---|---|---|---|---|
| 2025 | $2,574 | $247,500 | $95,402 | $152,098 |
| 2024 | $2,487 | $240,350 | $104,335 | $136,015 |
| 2023 | $2,270 | $406,000 | $119,641 | $286,359 |
| 2022 | $2,413 | $238,700 | $72,048 | $166,652 |
| 2021 | $2,194 | $322,000 | $92,123 | $229,877 |
| 2020 | $1,907 | $277,000 | $79,316 | $197,684 |
| 2019 | $1,966 | $279,000 | $90,770 | $188,230 |
| 2018 | $1,722 | $240,000 | $76,421 | $163,579 |
| 2016 | $1,529 | $110,055 | $29,973 | $80,082 |
| 2015 | $1,464 | $100,210 | $29,973 | $70,237 |
| 2014 | $1,469 | $102,173 | $29,973 | $72,200 |
| 2013 | -- | $98,924 | $27,143 | $71,781 |
Source: Public Records
Map
Nearby Homes