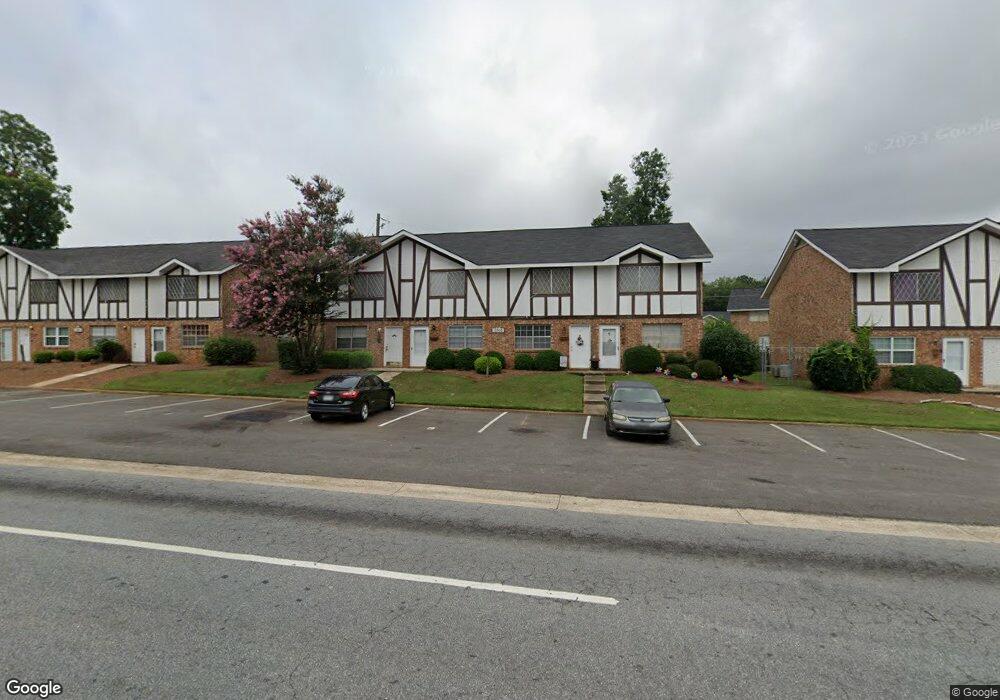
2503 Nottingham Way Albany, GA 31707
Sherwood NeighborhoodEstimated Value: $73,000 - $91,709
2
Beds
2
Baths
1,120
Sq Ft
$71/Sq Ft
Est. Value
About This Home
This home is located at 2503 Nottingham Way, Albany, GA 31707 and is currently estimated at $79,427, approximately $70 per square foot. 2503 Nottingham Way is a home located in Dougherty County with nearby schools including Sherwood Acres Elementary School, Merry Acres Middle School, and Westover High School.
Ownership History
Date
Name
Owned For
Owner Type
Purchase Details
Closed on
Mar 7, 2023
Sold by
Lynch Property Group Llc
Bought by
Sfmh Llc
Current Estimated Value
Purchase Details
Closed on
Dec 30, 2011
Sold by
Tri Properties Llc
Bought by
Lynch Property Group Llc
Purchase Details
Closed on
Nov 16, 2008
Sold by
Mitchell Gary
Bought by
Lynch Property Grp Llc
Purchase Details
Closed on
Aug 15, 2008
Sold by
Lynch Property Grp Llc
Bought by
Tri Properties Llc
Purchase Details
Closed on
Oct 21, 2005
Sold by
Duren Brian
Bought by
Hazel Tommy W and Hazel Jeremy Lynch
Purchase Details
Closed on
Nov 5, 2002
Sold by
Albany Brokerage Co Inc By Atty In Fact
Bought by
Duren Brian
Purchase Details
Closed on
Mar 18, 1994
Sold by
Albany Brokerage Co Inc
Bought by
Gray Billy C
Purchase Details
Closed on
Oct 29, 1982
Sold by
Miller Charles
Bought by
Albany Brokerage Co
Create a Home Valuation Report for This Property
The Home Valuation Report is an in-depth analysis detailing your home's value as well as a comparison with similar homes in the area
Home Values in the Area
Average Home Value in this Area
Purchase History
| Date | Buyer | Sale Price | Title Company |
|---|---|---|---|
| Sfmh Llc | $23,900 | -- | |
| Lynch Property Group Llc | $35,000 | -- | |
| Lynch Property Grp Llc | $2,000 | -- | |
| Tri Properties Llc | -- | -- | |
| Hazel Tommy W | $35,000 | -- | |
| Duren Brian | -- | -- | |
| Gray Billy C | -- | -- | |
| Albany Brokerage Co | -- | -- |
Source: Public Records
Tax History Compared to Growth
Tax History
| Year | Tax Paid | Tax Assessment Tax Assessment Total Assessment is a certain percentage of the fair market value that is determined by local assessors to be the total taxable value of land and additions on the property. | Land | Improvement |
|---|---|---|---|---|
| 2024 | $477 | $10,000 | $1,520 | $8,480 |
| 2023 | $466 | $10,000 | $1,520 | $8,480 |
| 2022 | $468 | $10,000 | $1,520 | $8,480 |
| 2021 | $434 | $10,000 | $1,520 | $8,480 |
| 2020 | $435 | $10,000 | $1,520 | $8,480 |
| 2019 | $436 | $10,000 | $1,520 | $8,480 |
| 2018 | $438 | $10,000 | $1,520 | $8,480 |
| 2017 | $408 | $10,000 | $1,520 | $8,480 |
| 2016 | $408 | $10,000 | $1,520 | $8,480 |
| 2015 | $409 | $10,000 | $1,520 | $8,480 |
| 2014 | $404 | $10,000 | $1,520 | $8,480 |
Source: Public Records
Map
Nearby Homes
- 2515 Whispering Pines Rd
- 2316 Pembroke Dr
- 2440 Bassford Ln
- 2741 Mclain Ln
- 2024 Stuart Ave
- 2102 Acker Dr
- 2611 Pine Valley Rd
- 2708 Elton St
- 1929 Stuart Ave
- 2017 Acker Dr
- 1927 Stuart Ave
- 1913 Forest Glen Dr
- 2004 Gail Ave
- 2007 Acker Dr
- 2402 Hilltop Dr
- 150 Stilwell Cir
- 2526 Hilltop Dr
- 2528 Hilltop Dr
- 1804 Acker Dr
- 1801 Oak Glen Ln
- 2503 Nottingham Way
- 2503 Nottingham Way
- 2503 Nottingham Way
- 2503 Nottingham Way
- 2505 Nottingham Way
- 2505 Nottingham Way
- 2505 Nottingham Way
- 2505 Nottingham Way
- 2501 Nottingham Way Unit 1
- 2501 Nottingham Way
- 2501 Nottingham Way
- 2501 Nottingham Way
- 2501 Nottingham Way
- 2502 Redwood Ct
- 2502 Redwood Ct
- 2502 Redwood Ct
- 2502 Redwood Ct
- 2506 #3 Redwood Ct
- 2504 Redwood Ct Unit 3
- 2504 Redwood Ct