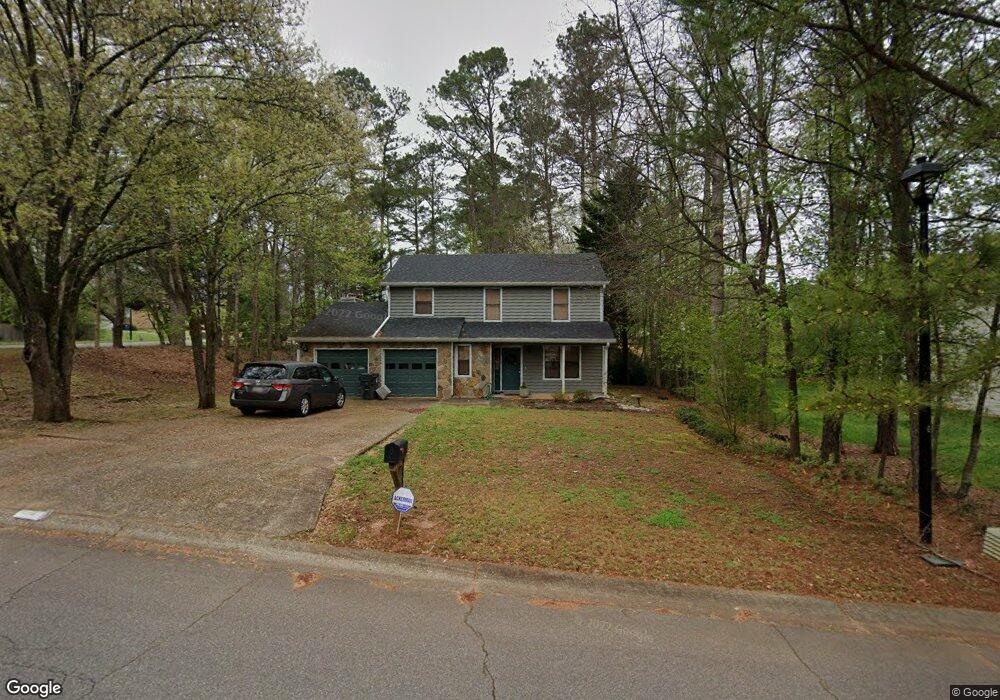
2503 Padens Chase Way Unit 5 Lawrenceville, GA 30044
Gwinnett Place NeighborhoodEstimated Value: $311,000 - $355,740
3
Beds
3
Baths
1,866
Sq Ft
$182/Sq Ft
Est. Value
About This Home
This home is located at 2503 Padens Chase Way Unit 5, Lawrenceville, GA 30044 and is currently estimated at $340,185, approximately $182 per square foot. 2503 Padens Chase Way Unit 5 is a home located in Gwinnett County with nearby schools including J.A. Alford Elementary School, Richards Middle School, and Discovery High School.
Ownership History
Date
Name
Owned For
Owner Type
Purchase Details
Closed on
May 22, 2015
Sold by
Wang Zhen Hua
Bought by
Rose Aninah
Current Estimated Value
Home Financials for this Owner
Home Financials are based on the most recent Mortgage that was taken out on this home.
Original Mortgage
$116,000
Outstanding Balance
$89,653
Interest Rate
3.77%
Mortgage Type
New Conventional
Estimated Equity
$250,532
Purchase Details
Closed on
Aug 17, 2009
Sold by
Homesales Inc
Bought by
Wang Yang P and Wang Zhen H
Purchase Details
Closed on
Jun 2, 2009
Sold by
Matson Richard G and Matson Kim E
Bought by
Homesales Inc
Purchase Details
Closed on
Feb 23, 1998
Sold by
Graves Louis G and Graves Virginia C
Bought by
Matson Richard G
Home Financials for this Owner
Home Financials are based on the most recent Mortgage that was taken out on this home.
Original Mortgage
$108,018
Interest Rate
6.95%
Mortgage Type
VA
Create a Home Valuation Report for This Property
The Home Valuation Report is an in-depth analysis detailing your home's value as well as a comparison with similar homes in the area
Home Values in the Area
Average Home Value in this Area
Purchase History
| Date | Buyer | Sale Price | Title Company |
|---|---|---|---|
| Rose Aninah | $128,000 | -- | |
| Wang Yang P | -- | -- | |
| Homesales Inc | $80,724 | -- | |
| Matson Richard G | $105,900 | -- |
Source: Public Records
Mortgage History
| Date | Status | Borrower | Loan Amount |
|---|---|---|---|
| Open | Rose Aninah | $116,000 | |
| Previous Owner | Matson Richard G | $108,018 |
Source: Public Records
Tax History Compared to Growth
Tax History
| Year | Tax Paid | Tax Assessment Tax Assessment Total Assessment is a certain percentage of the fair market value that is determined by local assessors to be the total taxable value of land and additions on the property. | Land | Improvement |
|---|---|---|---|---|
| 2024 | $3,310 | $117,320 | $21,600 | $95,720 |
| 2023 | $3,310 | $123,440 | $24,800 | $98,640 |
| 2022 | $2,979 | $103,120 | $20,000 | $83,120 |
| 2021 | $2,550 | $81,000 | $15,600 | $65,400 |
| 2020 | $2,447 | $75,440 | $15,600 | $59,840 |
| 2019 | $2,316 | $75,440 | $15,600 | $59,840 |
| 2018 | $2,061 | $63,960 | $12,320 | $51,640 |
| 2016 | $1,807 | $51,200 | $11,600 | $39,600 |
| 2015 | $1,917 | $46,040 | $8,400 | $37,640 |
| 2014 | -- | $46,040 | $8,400 | $37,640 |
Source: Public Records
Map
Nearby Homes
- 420 Padens Chase Ct
- 691 Paden Mill Trail Unit 2
- 356 Shannon Way
- 589 Creek View Dr Unit 1
- 266 Paden Cove Trail Unit 201
- 628 Creek View Dr
- 256 Paden Cove Trail
- 521 Provence Gate Ln
- 586 Chris Cir
- 679 Creek View Dr
- 442 Edwards Ct
- 2306 Kemp Dr
- 2696 Lawrenceville Hwy
- 2639 Summerfield Way
- 665 Shannon Way
- 660 Maple Crest Dr Unit 1
- 2503 Padens Chase Way
- 2503 Paden Chase Way Unit 5
- 2493 Padens Chase Way
- 511 Roys Ct
- 0 Padens Chase Way Unit 8492222
- 0 Padens Chase Way Unit 8175012
- 0 Padens Chase Way Unit 7065742
- 0 Padens Chase Way Unit 7029748
- 0 Padens Chase Way
- 507 Paden Dr
- 2513 Padens Chase Way
- 505 Paden Dr
- 0 Paden Dr Unit 10233113
- 0 Paden Dr Unit 7311253
- 0 Paden Dr Unit 20099908
- 0 Paden Dr Unit 7407127
- 0 Paden Dr Unit 7351206
- 0 Paden Dr Unit 7298748
- 0 Paden Dr Unit 7160882
- 0 Paden Dr Unit 8786607