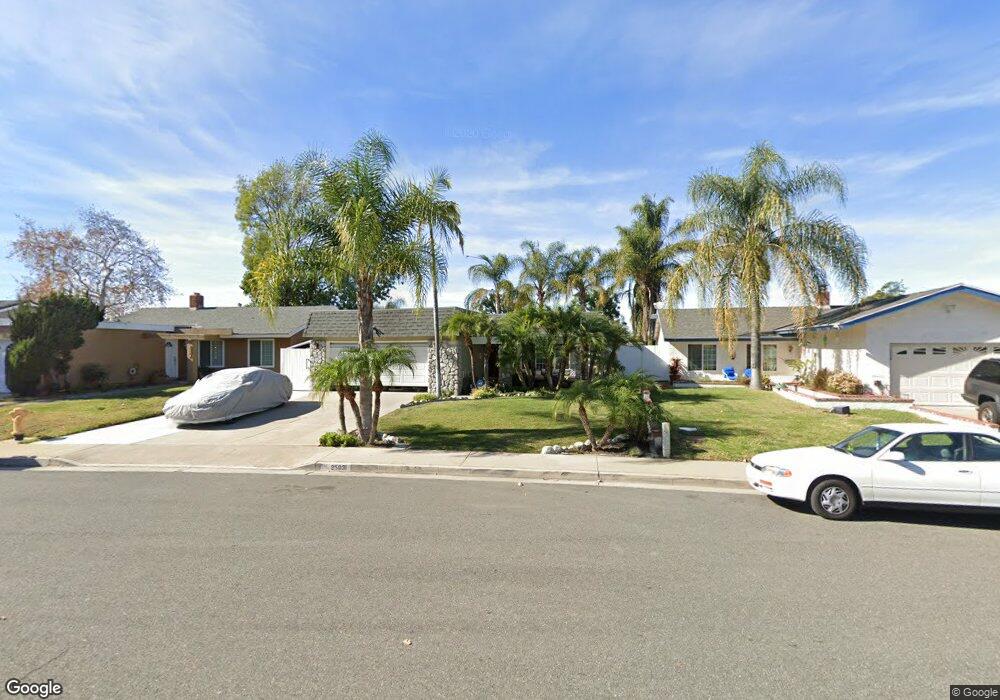
25031 Sutter Dr Laguna Hills, CA 92653
Estimated Value: $819,000 - $1,089,000
3
Beds
2
Baths
1,229
Sq Ft
$781/Sq Ft
Est. Value
About This Home
This home is located at 25031 Sutter Dr, Laguna Hills, CA 92653 and is currently estimated at $959,576, approximately $780 per square foot. 25031 Sutter Dr is a home located in Orange County with nearby schools including Lomarena Elementary School, La Paz Intermediate School, and Laguna Hills High.
Ownership History
Date
Name
Owned For
Owner Type
Purchase Details
Closed on
Nov 28, 2022
Sold by
Robertson Evan
Bought by
Robertson Evan and Corona Loraine Megan
Current Estimated Value
Purchase Details
Closed on
Feb 2, 2009
Sold by
Corona Rhonda C and Corona Ryan R
Bought by
Corona Ryan R and Corona Rhonda C
Home Financials for this Owner
Home Financials are based on the most recent Mortgage that was taken out on this home.
Original Mortgage
$164,000
Interest Rate
5.04%
Mortgage Type
New Conventional
Purchase Details
Closed on
Sep 4, 1996
Sold by
Bonham Charles A
Bought by
Corona Rhonda C and Corona Ryan R
Purchase Details
Closed on
Aug 16, 1993
Sold by
Dannettell James Bryan and Dannettell Dorene M
Bought by
Corona Ryan and Corona Rhonda
Home Financials for this Owner
Home Financials are based on the most recent Mortgage that was taken out on this home.
Original Mortgage
$132,000
Interest Rate
3.75%
Create a Home Valuation Report for This Property
The Home Valuation Report is an in-depth analysis detailing your home's value as well as a comparison with similar homes in the area
Home Values in the Area
Average Home Value in this Area
Purchase History
| Date | Buyer | Sale Price | Title Company |
|---|---|---|---|
| Robertson Evan | -- | First American Title | |
| Corona Ryan R | -- | First American Title Company | |
| Corona Rhonda C | -- | -- | |
| Corona Ryan | $166,000 | California Counties Title Co |
Source: Public Records
Mortgage History
| Date | Status | Borrower | Loan Amount |
|---|---|---|---|
| Previous Owner | Corona Ryan R | $164,000 | |
| Previous Owner | Corona Ryan | $132,000 |
Source: Public Records
Tax History
| Year | Tax Paid | Tax Assessment Tax Assessment Total Assessment is a certain percentage of the fair market value that is determined by local assessors to be the total taxable value of land and additions on the property. | Land | Improvement |
|---|---|---|---|---|
| 2025 | $2,665 | $269,527 | $169,259 | $100,268 |
| 2024 | $2,665 | $264,243 | $165,941 | $98,302 |
| 2023 | $2,601 | $259,062 | $162,687 | $96,375 |
| 2022 | $2,554 | $253,983 | $159,497 | $94,486 |
| 2021 | $2,501 | $249,003 | $156,369 | $92,634 |
| 2020 | $2,479 | $246,450 | $154,765 | $91,685 |
| 2019 | $2,428 | $241,618 | $151,730 | $89,888 |
| 2018 | $2,381 | $236,881 | $148,755 | $88,126 |
| 2017 | $2,332 | $232,237 | $145,838 | $86,399 |
| 2016 | $2,293 | $227,684 | $142,979 | $84,705 |
| 2015 | $2,264 | $224,264 | $140,831 | $83,433 |
| 2014 | $2,213 | $219,871 | $138,072 | $81,799 |
Source: Public Records
Map
Nearby Homes
- 24955 Wells Fargo Dr
- 25141 Madeira
- 24782 Argus Dr
- 24621 Artemia Ave
- 25452 Champlain Rd
- 25912 Spruce Ln
- 25511 Alisal Ave
- 25071 Mawson Dr
- 24422 Aphena Ave
- 25921 Tree Top Rd
- 25462 Gallup Cir
- 26191 San Roque Dr
- 25422 Pacifica Ave
- 24892 Grissom Rd
- 25061 Silverleaf Ln
- 24182 Adonis St
- 25901 Nellie Gail Rd
- 24772 Weyburn Dr
- 24141 Roma Dr
- 25981 Cordillera Dr
- 25025 Sutter Dr
- 25041 Sutter Dr
- 25012 Express Dr
- 25002 Express Dr
- 25021 Sutter Dr
- 24992 Express Dr
- 25051 Sutter Dr
- 25022 Express Dr
- 24982 Express Dr
- 25011 Sutter Dr
- 25042 Sutter Dr
- 24976 Express Dr
- 25012 Sutter Dr
- 25001 Sutter Dr
- 25601 Califia Dr
- 25002 Sutter Dr
- 24972 Express Dr
- 25611 Califia Dr
- 25621 Califia Dr
- 24991 Sutter Dr
Your Personal Tour Guide
Ask me questions while you tour the home.