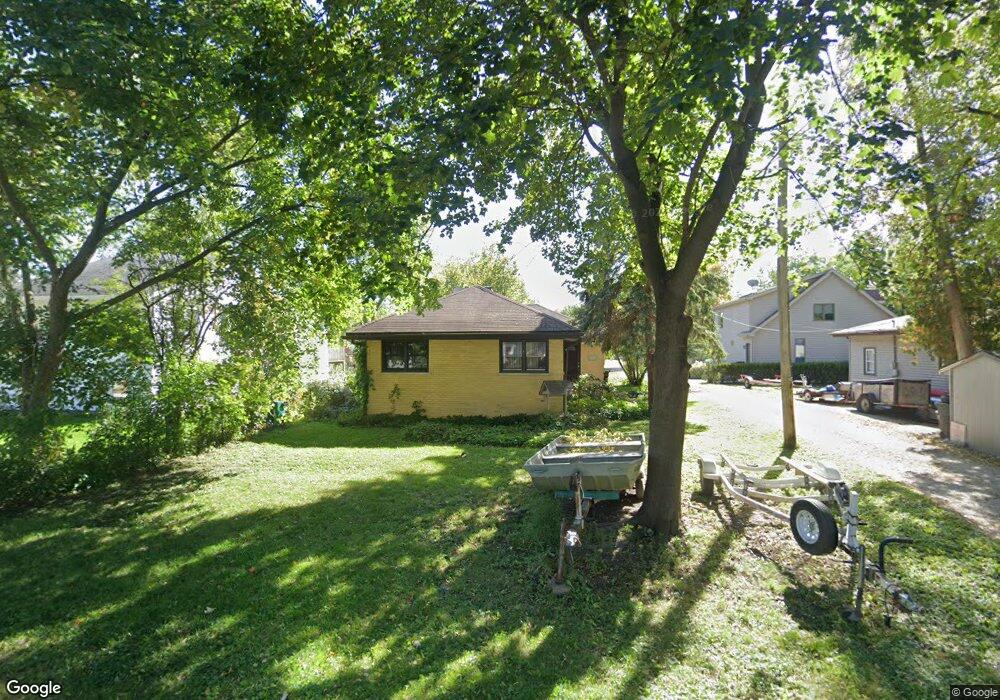
25035 W 2nd St Antioch, IL 60002
Lake Catherine NeighborhoodEstimated Value: $228,000 - $308,000
3
Beds
1
Bath
1,232
Sq Ft
$203/Sq Ft
Est. Value
About This Home
This home is located at 25035 W 2nd St, Antioch, IL 60002 and is currently estimated at $250,368, approximately $203 per square foot. 25035 W 2nd St is a home located in Lake County with nearby schools including Antioch Community High School.
Ownership History
Date
Name
Owned For
Owner Type
Purchase Details
Closed on
Apr 9, 2025
Sold by
Bloom David D and Bloom Eva V
Bought by
David D Bloom Revocable Trust and Bloom
Current Estimated Value
Purchase Details
Closed on
Feb 15, 2012
Sold by
Bank Of New York Mellon
Bought by
Bloom David
Purchase Details
Closed on
Apr 14, 2011
Sold by
Palmowski Karen
Bought by
Bank Of New York Mellon and The Bank Of New York
Purchase Details
Closed on
Jul 23, 2005
Sold by
Adams Anita
Bought by
Palmowski Karen
Home Financials for this Owner
Home Financials are based on the most recent Mortgage that was taken out on this home.
Original Mortgage
$31,600
Interest Rate
5.66%
Mortgage Type
Credit Line Revolving
Purchase Details
Closed on
Nov 20, 1998
Sold by
Simmons William Hanson and Simmons Faye
Bought by
Adams Anita A
Home Financials for this Owner
Home Financials are based on the most recent Mortgage that was taken out on this home.
Original Mortgage
$88,800
Interest Rate
6.8%
Create a Home Valuation Report for This Property
The Home Valuation Report is an in-depth analysis detailing your home's value as well as a comparison with similar homes in the area
Home Values in the Area
Average Home Value in this Area
Purchase History
| Date | Buyer | Sale Price | Title Company |
|---|---|---|---|
| David D Bloom Revocable Trust | -- | None Listed On Document | |
| Bloom David | $51,000 | First American Title Ins Co | |
| Bank Of New York Mellon | -- | None Available | |
| Palmowski Karen | $158,000 | -- | |
| Adams Anita A | $118,500 | Ticor Title |
Source: Public Records
Mortgage History
| Date | Status | Borrower | Loan Amount |
|---|---|---|---|
| Previous Owner | Palmowski Karen | $31,600 | |
| Previous Owner | Palmowski Karen | $126,400 | |
| Previous Owner | Adams Anita A | $88,800 |
Source: Public Records
Tax History Compared to Growth
Tax History
| Year | Tax Paid | Tax Assessment Tax Assessment Total Assessment is a certain percentage of the fair market value that is determined by local assessors to be the total taxable value of land and additions on the property. | Land | Improvement |
|---|---|---|---|---|
| 2024 | $4,876 | $54,022 | $3,976 | $50,046 |
| 2023 | $4,876 | $48,372 | $3,560 | $44,812 |
| 2022 | $4,732 | $46,039 | $4,155 | $41,884 |
| 2021 | $4,401 | $42,959 | $3,877 | $39,082 |
| 2020 | $4,319 | $41,773 | $3,770 | $38,003 |
| 2019 | $4,412 | $39,947 | $3,605 | $36,342 |
| 2018 | $4,653 | $41,052 | $2,595 | $38,457 |
| 2017 | $4,829 | $42,708 | $2,470 | $40,238 |
| 2016 | $4,724 | $41,216 | $2,384 | $38,832 |
| 2015 | $4,703 | $40,167 | $2,323 | $37,844 |
| 2014 | $1,834 | $16,998 | $5,180 | $11,818 |
| 2012 | $1,685 | $16,998 | $5,180 | $11,818 |
Source: Public Records
Map
Nearby Homes
- 25022 W Catherine Ave
- 25118 W Catherine Ave
- 25076 W Edgar Ave
- 782 Cameron Dr
- 43247 N Grandview Terrace
- 811 Tiffany Farms Rd
- 42425 N Park Ln
- 25174 W Claridan Ave
- 43380 N Mildred Ave
- 735 Creek Bend Ln
- 24816 W Il Route 173
- 12621 257th Ave
- 42161 N 1st Ave
- 775 Highview Ct
- 0 Highview Dr Unit MRD11912210
- 25612 W Woodlawn Ave
- 42136 N 7th Ave
- 336 Hawthorn Ln
- 603 Ridgewood Dr
- 558 1st St
- 25025 W 2nd St
- 25051 W 2nd St
- 42909 N Lenora St
- 25007 W 2nd St
- 25036 W 3rd St
- 25018 W 3rd St
- 42959 N Lenora St
- 42877 N Lenora St
- 25036 W 2nd St
- 25026 W 2nd St
- 25010 W 3rd St
- 42915 N Janette St
- 42931 N Janette St
- 25010 W 2nd St
- 42941 N Janette St
- 42901 N Janette St
- 42951 N Janette St
- 42961 N Janette St
- 42879 N Janette St
- 25035 W 1st St