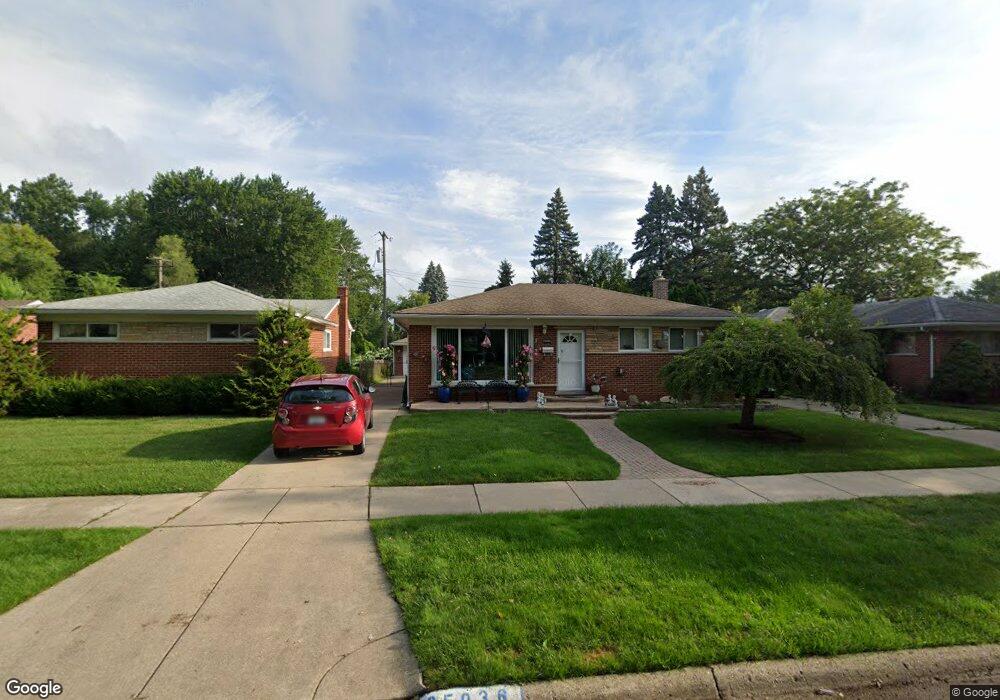
25036 Westfield Redford, MI 48239
Estimated Value: $182,147 - $249,000
--
Bed
1
Bath
1,055
Sq Ft
$196/Sq Ft
Est. Value
About This Home
This home is located at 25036 Westfield, Redford, MI 48239 and is currently estimated at $206,537, approximately $195 per square foot. 25036 Westfield is a home located in Wayne County with nearby schools including John D. Pierce Middle School, Lee M. Thurston High School, and Global Heights Academy.
Ownership History
Date
Name
Owned For
Owner Type
Purchase Details
Closed on
Jan 5, 2024
Sold by
Ellis-Macias Ann M
Bought by
Ellis Judy S
Current Estimated Value
Home Financials for this Owner
Home Financials are based on the most recent Mortgage that was taken out on this home.
Original Mortgage
$166,056
Outstanding Balance
$163,332
Interest Rate
7.29%
Mortgage Type
FHA
Estimated Equity
$43,205
Purchase Details
Closed on
May 31, 2001
Sold by
Ellis Maris Amparo
Bought by
Ellis Ann M
Create a Home Valuation Report for This Property
The Home Valuation Report is an in-depth analysis detailing your home's value as well as a comparison with similar homes in the area
Home Values in the Area
Average Home Value in this Area
Purchase History
| Date | Buyer | Sale Price | Title Company |
|---|---|---|---|
| Ellis Judy S | $192,000 | None Listed On Document | |
| Ellis Judy S | $192,000 | None Listed On Document | |
| Ellis Ann M | -- | -- |
Source: Public Records
Mortgage History
| Date | Status | Borrower | Loan Amount |
|---|---|---|---|
| Open | Ellis Judy S | $166,056 | |
| Closed | Ellis Judy S | $166,056 |
Source: Public Records
Tax History Compared to Growth
Tax History
| Year | Tax Paid | Tax Assessment Tax Assessment Total Assessment is a certain percentage of the fair market value that is determined by local assessors to be the total taxable value of land and additions on the property. | Land | Improvement |
|---|---|---|---|---|
| 2025 | $764 | $91,000 | $0 | $0 |
| 2024 | $764 | $83,700 | $0 | $0 |
| 2023 | $732 | $74,500 | $0 | $0 |
| 2022 | $2,153 | $66,300 | $0 | $0 |
| 2021 | $2,092 | $62,800 | $0 | $0 |
| 2020 | $2,064 | $54,000 | $0 | $0 |
| 2019 | $2,020 | $48,300 | $0 | $0 |
| 2018 | $659 | $39,900 | $0 | $0 |
| 2017 | $2,279 | $37,600 | $0 | $0 |
| 2016 | $1,776 | $37,300 | $0 | $0 |
| 2015 | $2,766 | $33,900 | $0 | $0 |
| 2013 | $2,680 | $27,400 | $0 | $0 |
| 2012 | $1,678 | $30,100 | $7,300 | $22,800 |
Source: Public Records
Map
Nearby Homes