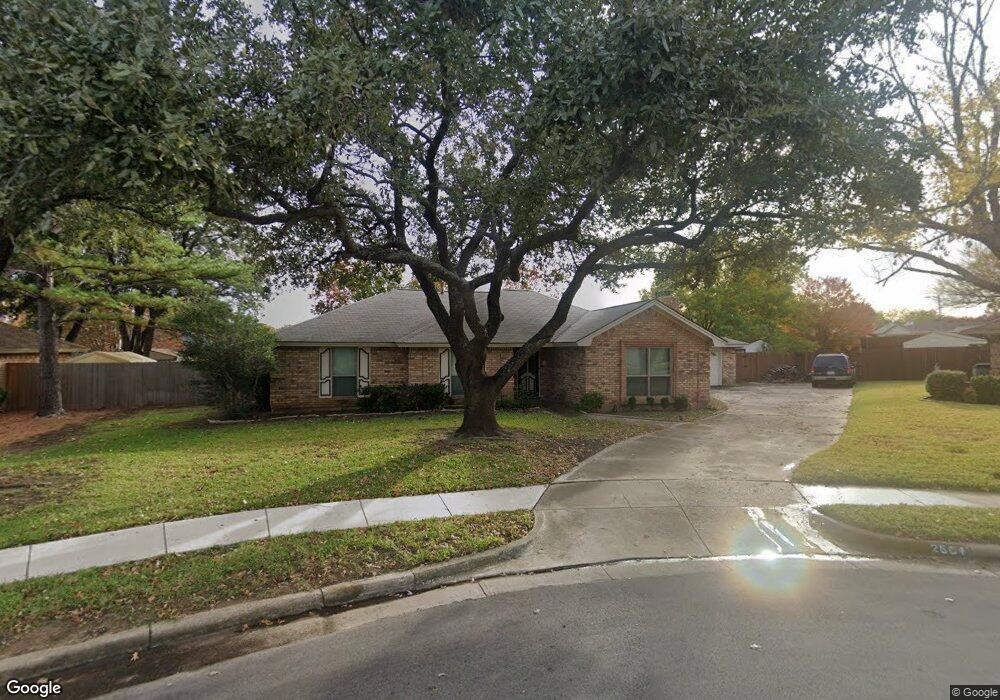
2504 Dartmouth Ct Bedford, TX 76022
Estimated Value: $319,000 - $368,000
3
Beds
2
Baths
1,736
Sq Ft
$199/Sq Ft
Est. Value
About This Home
This home is located at 2504 Dartmouth Ct, Bedford, TX 76022 and is currently estimated at $346,073, approximately $199 per square foot. 2504 Dartmouth Ct is a home located in Tarrant County with nearby schools including Bell Manor Elementary School, Central J High School, and Trinity High School.
Ownership History
Date
Name
Owned For
Owner Type
Purchase Details
Closed on
Mar 21, 2017
Sold by
Adams Joseph
Bought by
Adams Linda
Current Estimated Value
Purchase Details
Closed on
Apr 27, 2007
Sold by
Carkin Pamela D and Carkin Pamela Dawn
Bought by
Adams Joseph A and Adams Linda J
Home Financials for this Owner
Home Financials are based on the most recent Mortgage that was taken out on this home.
Original Mortgage
$143,910
Interest Rate
5.5%
Mortgage Type
Purchase Money Mortgage
Purchase Details
Closed on
Jul 12, 2000
Sold by
Carkin Michael Laurence
Bought by
Carkin Pamela Dawn
Purchase Details
Closed on
Dec 19, 1997
Sold by
Greer Terry G and Kizziar Barbara
Bought by
Carkin Michael L and Carkin Pamela D
Home Financials for this Owner
Home Financials are based on the most recent Mortgage that was taken out on this home.
Original Mortgage
$112,520
Interest Rate
7.18%
Create a Home Valuation Report for This Property
The Home Valuation Report is an in-depth analysis detailing your home's value as well as a comparison with similar homes in the area
Home Values in the Area
Average Home Value in this Area
Purchase History
| Date | Buyer | Sale Price | Title Company |
|---|---|---|---|
| Adams Linda | -- | None Available | |
| Adams Joseph A | -- | Alamo Title Company | |
| Carkin Pamela Dawn | -- | -- | |
| Carkin Michael L | -- | Commonwealth Land Title |
Source: Public Records
Mortgage History
| Date | Status | Borrower | Loan Amount |
|---|---|---|---|
| Previous Owner | Adams Joseph A | $143,910 | |
| Previous Owner | Carkin Michael L | $112,520 |
Source: Public Records
Tax History Compared to Growth
Tax History
| Year | Tax Paid | Tax Assessment Tax Assessment Total Assessment is a certain percentage of the fair market value that is determined by local assessors to be the total taxable value of land and additions on the property. | Land | Improvement |
|---|---|---|---|---|
| 2025 | $2,988 | $330,000 | $75,000 | $255,000 |
| 2024 | $2,988 | $350,031 | $75,000 | $275,031 |
| 2023 | $5,106 | $330,850 | $45,000 | $285,850 |
| 2022 | $5,286 | $284,542 | $45,000 | $239,542 |
| 2021 | $5,182 | $220,000 | $45,000 | $175,000 |
| 2020 | $5,231 | $220,000 | $45,000 | $175,000 |
| 2019 | $5,223 | $220,000 | $45,000 | $175,000 |
| 2018 | $4,367 | $195,467 | $22,000 | $173,467 |
| 2017 | $4,449 | $217,849 | $22,000 | $195,849 |
| 2016 | $4,045 | $181,281 | $22,000 | $159,281 |
| 2015 | $3,685 | $152,000 | $22,000 | $130,000 |
| 2014 | $3,685 | $157,700 | $22,000 | $135,700 |
Source: Public Records
Map
Nearby Homes
- 2420 Dalewood Ln
- 1049 Stableway Ln
- 2428 Chestnut Way
- 828 Gregory Ave
- 800 Prestwick St
- 2620 Britany Cir
- 808 Gregory Ave
- 1116 Highpoint Rd
- 2504 Westpark Way Cir
- 2101 Gettysburg Place
- 2024 Charleston Dr
- 1213 Greendale Dr
- 2303 Mcmullin Dr
- 2421 Creek Villas Dr
- 2201 Greendale Ct
- 1216 Princeton Place
- 2025 Schumac Ln
- 2150 Eva Ln
- 952 Charleston Dr
- 804 Natchez Ave
- 2500 Dartmouth Ct
- 2505 Rochester Ct
- 2508 Dartmouth Ct
- 2501 Rochester Ct
- 2509 Rochester Ct
- 2512 Dartmouth Ct
- 2501 Dartmouth Ct
- 2505 Dartmouth Ct
- 2513 Rochester Ct
- 2509 Dartmouth Ct
- 2509 Gettysburg Place
- 2500 Rochester Ct
- 2516 Dartmouth Ct
- 2513 Dartmouth Ct
- 2517 Rochester Ct
- 2512 Gettysburg Place
- 2504 Rochester Ct
- 2508 Rochester Ct
- 2412 Dalewood Ln
- 2508 Gettysburg Place