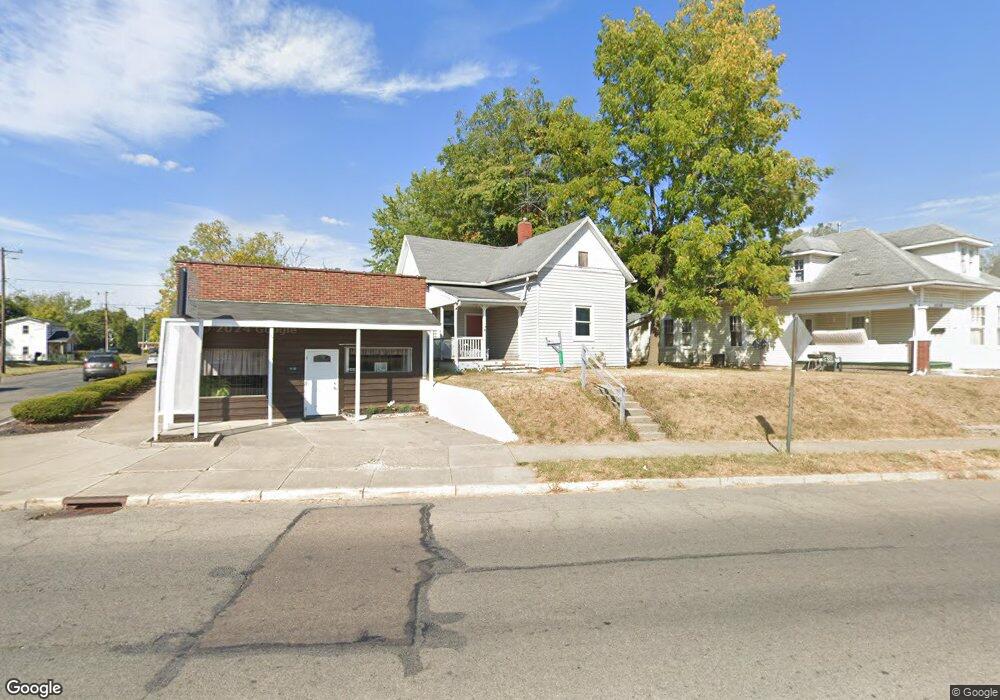
2504 E High St Springfield, OH 45505
Estimated Value: $86,731 - $118,000
1
Bed
1
Bath
816
Sq Ft
$125/Sq Ft
Est. Value
About This Home
This home is located at 2504 E High St, Springfield, OH 45505 and is currently estimated at $101,683, approximately $124 per square foot. 2504 E High St is a home located in Clark County with nearby schools including Mann Elementary School, Schaefer Middle School, and Springfield High School.
Ownership History
Date
Name
Owned For
Owner Type
Purchase Details
Closed on
Oct 19, 2009
Sold by
Wesbanco Bank Inc
Bought by
Detrick Michael and Detrick Carol
Current Estimated Value
Purchase Details
Closed on
Aug 29, 2008
Sold by
Mann Charles D
Bought by
Wesbanco Bank Inc
Purchase Details
Closed on
May 16, 2001
Sold by
Baumgardner Christina J
Bought by
Mann Charles D
Home Financials for this Owner
Home Financials are based on the most recent Mortgage that was taken out on this home.
Original Mortgage
$41,800
Interest Rate
7.02%
Mortgage Type
Purchase Money Mortgage
Purchase Details
Closed on
Jun 23, 2000
Sold by
Lee Roger D and Lee Kathie A
Bought by
Baumgardner Christina J
Home Financials for this Owner
Home Financials are based on the most recent Mortgage that was taken out on this home.
Original Mortgage
$43,725
Interest Rate
8.56%
Mortgage Type
Purchase Money Mortgage
Create a Home Valuation Report for This Property
The Home Valuation Report is an in-depth analysis detailing your home's value as well as a comparison with similar homes in the area
Home Values in the Area
Average Home Value in this Area
Purchase History
| Date | Buyer | Sale Price | Title Company |
|---|---|---|---|
| Detrick Michael | $16,000 | Attorney | |
| Wesbanco Bank Inc | $32,000 | None Available | |
| Mann Charles D | $44,000 | -- | |
| Baumgardner Christina J | $49,000 | -- |
Source: Public Records
Mortgage History
| Date | Status | Borrower | Loan Amount |
|---|---|---|---|
| Previous Owner | Mann Charles D | $41,800 | |
| Previous Owner | Baumgardner Christina J | $43,725 |
Source: Public Records
Tax History
| Year | Tax Paid | Tax Assessment Tax Assessment Total Assessment is a certain percentage of the fair market value that is determined by local assessors to be the total taxable value of land and additions on the property. | Land | Improvement |
|---|---|---|---|---|
| 2025 | $797 | $19,830 | $5,120 | $14,710 |
| 2024 | $777 | $15,730 | $4,710 | $11,020 |
| 2023 | $777 | $15,730 | $4,710 | $11,020 |
| 2022 | $796 | $15,730 | $4,710 | $11,020 |
| 2021 | $670 | $12,190 | $3,650 | $8,540 |
| 2020 | $671 | $12,190 | $3,650 | $8,540 |
| 2019 | $673 | $12,190 | $3,650 | $8,540 |
| 2018 | $713 | $12,400 | $4,150 | $8,250 |
| 2017 | $713 | $12,405 | $4,155 | $8,250 |
| 2016 | $714 | $12,405 | $4,155 | $8,250 |
| 2015 | $768 | $13,098 | $4,155 | $8,943 |
| 2014 | $765 | $13,098 | $4,155 | $8,943 |
| 2013 | $757 | $13,098 | $4,155 | $8,943 |
Source: Public Records
Map
Nearby Homes
- 115 S Burnett Rd
- 2425 Kenilworth Ave
- 129 N Burnett Rd
- 2702 Maplewood Ave
- 360 Buxton Ave
- 250 S Douglas Ave Unit 254
- 374 Raffensperger Ave
- 2730 E Main St
- 26 N Belmont Ave
- 375 N Fostoria Ave
- 2201 Woodside Ave
- 2338 Dellwood Dr
- 1721 Prospect St
- 138 Lawnview Ave
- 1664 Warder St
- 2804 Lowman St
- 3012 E High St
- 1621 Morgan St
- 2020 Woodside Ave
- 743 N Belmont Ave
- 2510 E High St
- 2520 E High St
- 110 Buxton Ave Unit 112
- 2444 E High St
- 2524 E High St
- 2435 E High St
- 109 Buxton Ave
- 40 Buxton Ave
- 2427 E High St
- 2440 E High St
- 34 Buxton Ave
- 2530 E High St
- 219 Buxton Ave
- 41 Buxton Ave
- 2521 E High St
- 32 Buxton Ave
- 2532 E High St
- 2424 E High St Unit 2426
- 29 Buxton Ave
- 223 Buxton Ave
Your Personal Tour Guide
Ask me questions while you tour the home.