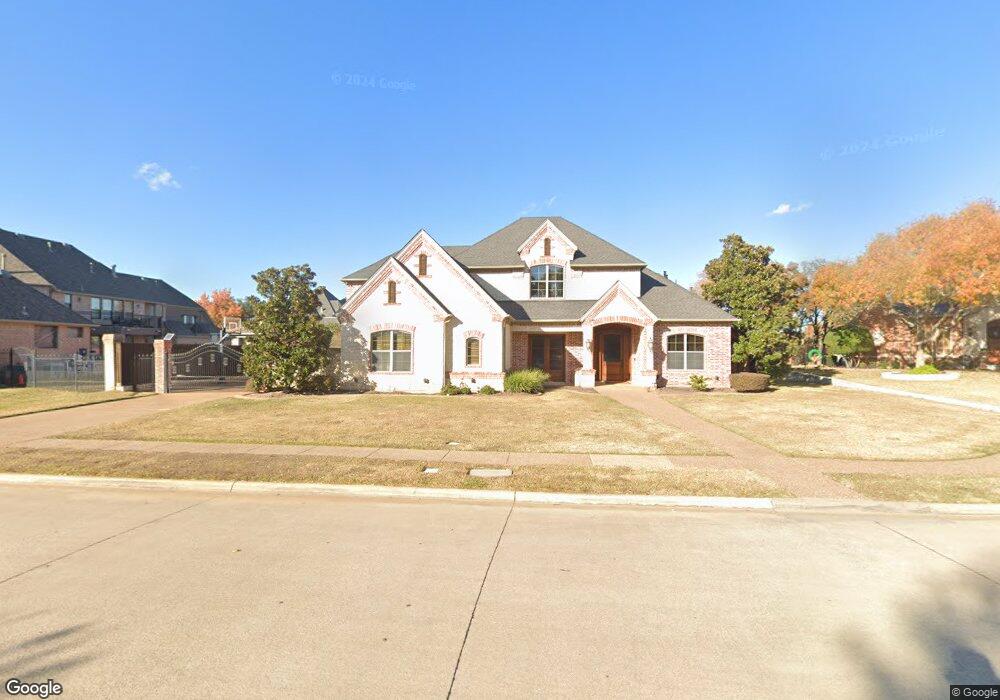
2504 Flintlock Ct Colleyville, TX 76034
Estimated Value: $1,560,000 - $1,739,000
5
Beds
4
Baths
6,099
Sq Ft
$270/Sq Ft
Est. Value
About This Home
This home is located at 2504 Flintlock Ct, Colleyville, TX 76034 and is currently estimated at $1,649,643, approximately $270 per square foot. 2504 Flintlock Ct is a home located in Tarrant County with nearby schools including Glenhope Elementary School, Cross Timbers Middle School, and Grapevine High School.
Ownership History
Date
Name
Owned For
Owner Type
Purchase Details
Closed on
Aug 4, 2004
Sold by
Boudreaux Mark Joseph
Bought by
Heygood Michael E
Current Estimated Value
Home Financials for this Owner
Home Financials are based on the most recent Mortgage that was taken out on this home.
Original Mortgage
$508,125
Outstanding Balance
$209,458
Interest Rate
3.5%
Mortgage Type
Purchase Money Mortgage
Estimated Equity
$1,440,185
Purchase Details
Closed on
Mar 29, 2001
Sold by
Matheus Joseph R and Matheus Ruth
Bought by
Boudreaux Mark J and Boudreaux Denise
Home Financials for this Owner
Home Financials are based on the most recent Mortgage that was taken out on this home.
Original Mortgage
$108,000
Interest Rate
6.98%
Purchase Details
Closed on
May 6, 1997
Sold by
Raw Inc
Bought by
Matheus Joseph R
Home Financials for this Owner
Home Financials are based on the most recent Mortgage that was taken out on this home.
Original Mortgage
$55,000
Interest Rate
8.16%
Create a Home Valuation Report for This Property
The Home Valuation Report is an in-depth analysis detailing your home's value as well as a comparison with similar homes in the area
Home Values in the Area
Average Home Value in this Area
Purchase History
| Date | Buyer | Sale Price | Title Company |
|---|---|---|---|
| Heygood Michael E | -- | Hexter Fair Title Company | |
| Boudreaux Mark J | -- | Alamo Title Company | |
| Matheus Joseph R | -- | Stewart Title |
Source: Public Records
Mortgage History
| Date | Status | Borrower | Loan Amount |
|---|---|---|---|
| Open | Heygood Michael E | $508,125 | |
| Previous Owner | Boudreaux Mark J | $108,000 | |
| Previous Owner | Matheus Joseph R | $55,000 |
Source: Public Records
Tax History Compared to Growth
Tax History
| Year | Tax Paid | Tax Assessment Tax Assessment Total Assessment is a certain percentage of the fair market value that is determined by local assessors to be the total taxable value of land and additions on the property. | Land | Improvement |
|---|---|---|---|---|
| 2025 | $17,971 | $1,544,434 | $352,650 | $1,191,784 |
| 2024 | $17,971 | $1,544,434 | $352,650 | $1,191,784 |
| 2023 | $19,355 | $1,315,474 | $352,650 | $962,824 |
| 2022 | $20,148 | $1,043,067 | $352,650 | $690,417 |
| 2021 | $21,759 | $990,826 | $202,500 | $788,326 |
| 2020 | $22,098 | $994,468 | $202,500 | $791,968 |
| 2019 | $23,076 | $998,111 | $202,500 | $795,611 |
| 2018 | $5,430 | $913,215 | $202,500 | $710,715 |
| 2017 | $19,922 | $843,288 | $202,500 | $640,788 |
| 2016 | $18,913 | $842,131 | $202,500 | $639,631 |
| 2015 | $16,668 | $727,800 | $96,000 | $631,800 |
| 2014 | $16,668 | $727,800 | $96,000 | $631,800 |
Source: Public Records
Map
Nearby Homes
- 2618 Pointe Ct
- 2602 Pointe Ct
- 3589 Boxwood Dr
- 2008 Kyle Ct
- 3206 Wintergreen Terrace
- 3223 Wintergreen Terrace
- 2406 Wilkes Dr
- 3107 Wintergreen Terrace
- 1813 Grosvenor Green
- 3904 Wagon Wheel Dr
- 5504 Sycamore Dr
- 3052 Ridgeview Dr
- 3032 Ridgebend Dr
- 5613 Versailles Ct
- 7001 Colleyville Blvd
- 3053 Sentinal Butte
- 3044 Old Mill Run
- 3329 Moss Creek Dr
- 3008 Creekview Dr
- 1509 Tinker Rd
- 2500 Flintlock Ct
- 2508 Flintlock Ct
- 6315 Regiment Place
- 2509 Flintlock Ct
- 2505 Flintlock Ct
- 2501 Flintlock Ct
- 6401 Regiment Place
- 6308 Regiment Place
- 6312 Regiment Place
- 6304 Regiment Place
- 6316 Regiment Place
- 6405 Regiment Place
- 2507 Heather Glenn Ct
- 6300 Regiment Place
- 6400 Regiment Place
- 6300 Pool Rd
- 6409 Regiment Place
- 2509 Independence Rd
- 2503 Heather Glenn Ct
- 6211 Connie Ln