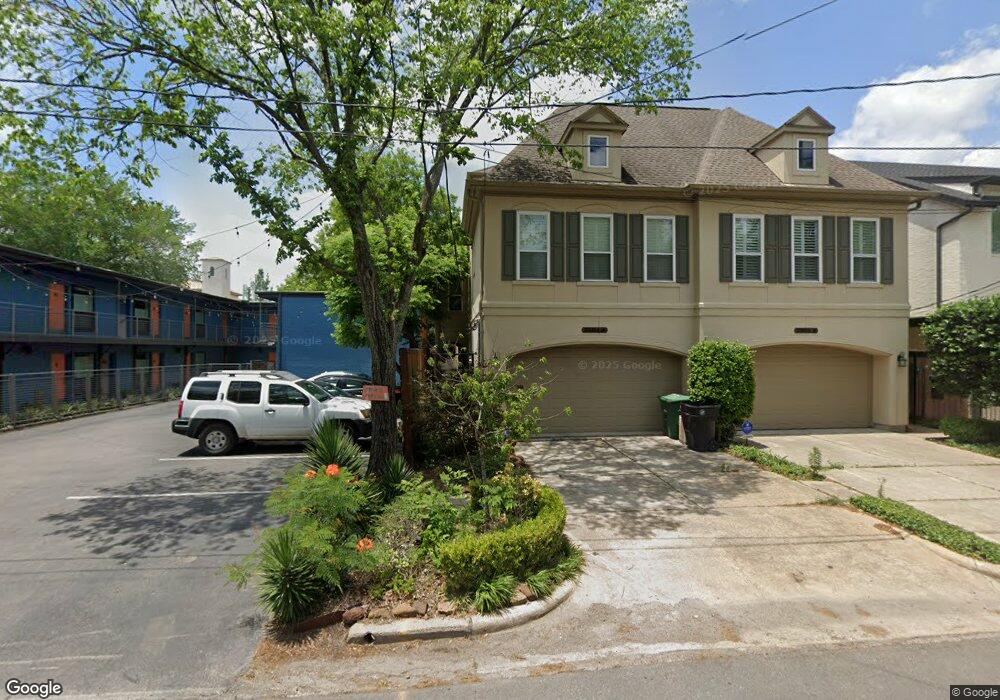
2504 Park St Houston, TX 77019
Montrose NeighborhoodEstimated Value: $621,000 - $908,000
3
Beds
3
Baths
2,675
Sq Ft
$274/Sq Ft
Est. Value
About This Home
This home is located at 2504 Park St, Houston, TX 77019 and is currently estimated at $734,073, approximately $274 per square foot. 2504 Park St is a home located in Harris County with nearby schools including Baker Montessori, Lanier Middle School, and Lamar High School.
Ownership History
Date
Name
Owned For
Owner Type
Purchase Details
Closed on
Aug 26, 2005
Sold by
Hill Sarah B
Bought by
Dunahoe Jason E and White Alexandra G
Current Estimated Value
Home Financials for this Owner
Home Financials are based on the most recent Mortgage that was taken out on this home.
Original Mortgage
$268,000
Outstanding Balance
$143,020
Interest Rate
5.81%
Mortgage Type
Fannie Mae Freddie Mac
Estimated Equity
$591,053
Purchase Details
Closed on
May 15, 2000
Sold by
Yahner Deborah B
Bought by
Hill Sarah B
Home Financials for this Owner
Home Financials are based on the most recent Mortgage that was taken out on this home.
Original Mortgage
$252,700
Interest Rate
8.18%
Purchase Details
Closed on
Oct 6, 1998
Sold by
5177 Builders Ltd
Bought by
Glover Steven A and Glover Crista M
Home Financials for this Owner
Home Financials are based on the most recent Mortgage that was taken out on this home.
Original Mortgage
$215,000
Interest Rate
6.92%
Create a Home Valuation Report for This Property
The Home Valuation Report is an in-depth analysis detailing your home's value as well as a comparison with similar homes in the area
Home Values in the Area
Average Home Value in this Area
Purchase History
| Date | Buyer | Sale Price | Title Company |
|---|---|---|---|
| Dunahoe Jason E | -- | Stewart Title | |
| Hill Sarah B | -- | -- | |
| Glover Steven A | -- | Charter Title Company |
Source: Public Records
Mortgage History
| Date | Status | Borrower | Loan Amount |
|---|---|---|---|
| Open | Dunahoe Jason E | $268,000 | |
| Previous Owner | Hill Sarah B | $252,700 | |
| Previous Owner | Glover Steven A | $215,000 | |
| Closed | Glover Steven A | $26,900 |
Source: Public Records
Tax History Compared to Growth
Tax History
| Year | Tax Paid | Tax Assessment Tax Assessment Total Assessment is a certain percentage of the fair market value that is determined by local assessors to be the total taxable value of land and additions on the property. | Land | Improvement |
|---|---|---|---|---|
| 2025 | $14,037 | $699,367 | $275,000 | $424,367 |
| 2024 | $14,037 | $670,862 | $275,000 | $395,862 |
| 2023 | $14,037 | $675,810 | $275,000 | $400,810 |
| 2022 | $13,548 | $615,302 | $275,000 | $340,302 |
| 2021 | $13,167 | $564,944 | $262,500 | $302,444 |
| 2020 | $12,592 | $519,985 | $262,500 | $257,485 |
| 2019 | $13,347 | $527,473 | $150,000 | $377,473 |
| 2018 | $6,857 | $500,800 | $150,000 | $350,800 |
| 2017 | $13,469 | $507,600 | $150,000 | $357,600 |
| 2016 | $14,142 | $532,956 | $150,000 | $382,956 |
| 2015 | $7,157 | $532,956 | $150,000 | $382,956 |
| 2014 | $7,157 | $457,300 | $131,250 | $326,050 |
Source: Public Records
Map
Nearby Homes
- 2415 Elmen St
- 1660 Hawthorne St
- 2314 Park St
- 1701 Hawthorne St
- 2413 Ralph St Unit 2
- 2506 Mandell St Unit 3
- 1660 Kipling St
- 2309 Driscoll St
- 1620 Harold St
- 1755 Kipling St
- 1539 Westheimer Rd
- 1900 Hawthorne St
- 2025 Park St
- 2505 Mcduffie St Unit B
- 1612 Kipling St
- 1709 Haver St
- 1728 Michigan St Unit A
- 1728 Michigan St Unit C
- 1634 Marshall St
- 1723 Marshall St
- 2504 Park St Unit A
- 2504 Park St Unit B
- 2502 Park St
- 2509 Elmen St
- 2428 Park St
- 2505 Elmen St
- 2503 Elmen St
- 2501 Park St
- 2503 Park St
- 2505 Park St
- 2501 Elmen St
- 2424 Park St
- 2424 Park St Unit 2
- 2509 Park St
- 1919 Missouri St
- 2503 1/2 Park St
- 2423 Elmen St
- 2422 Park St
- 2420 Park St Unit A
- 2423 Park St Unit A