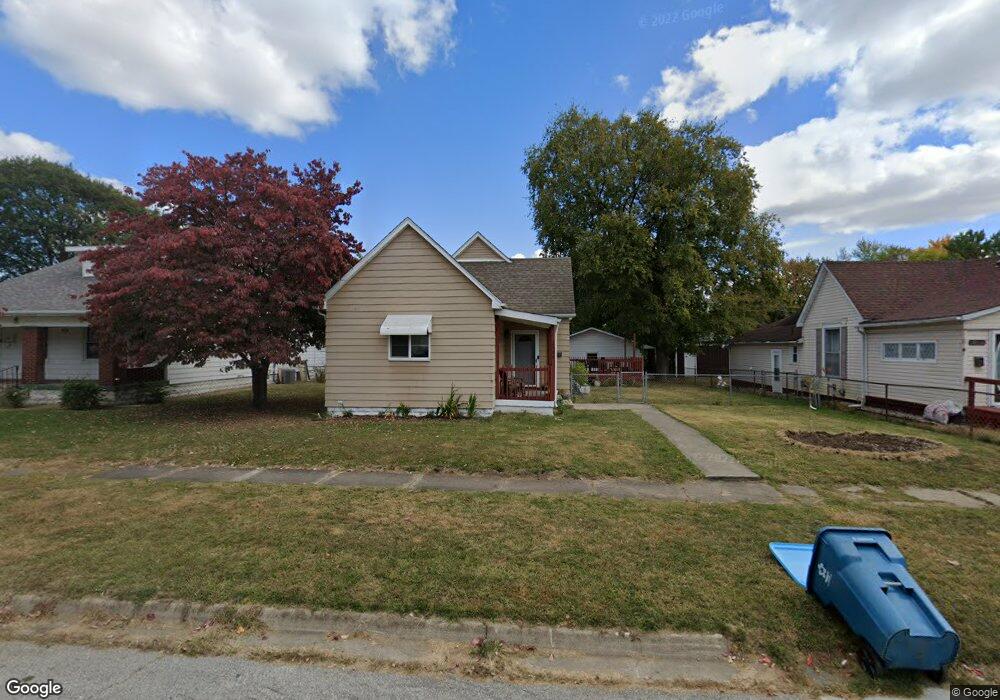
2504 S 8th St Terre Haute, IN 47802
Southland-Sarah Scott NeighborhoodEstimated Value: $101,000 - $127,950
3
Beds
1
Bath
1,348
Sq Ft
$83/Sq Ft
Est. Value
About This Home
This home is located at 2504 S 8th St, Terre Haute, IN 47802 and is currently estimated at $112,238, approximately $83 per square foot. 2504 S 8th St is a home located in Vigo County with nearby schools including Blanche E. Fuqua Elementary School, Sarah Scott Middle School, and Terre Haute South Vigo High School.
Ownership History
Date
Name
Owned For
Owner Type
Purchase Details
Closed on
Aug 8, 2016
Sold by
Arnold Kyle W and Ketner Erica K
Bought by
Parker Misty L
Current Estimated Value
Home Financials for this Owner
Home Financials are based on the most recent Mortgage that was taken out on this home.
Original Mortgage
$72,485
Outstanding Balance
$57,835
Interest Rate
3.48%
Mortgage Type
New Conventional
Estimated Equity
$54,403
Purchase Details
Closed on
Aug 3, 2011
Sold by
Premier Manufactured Homes Inc
Bought by
Arnold Kyle W and Ketner Erica K
Home Financials for this Owner
Home Financials are based on the most recent Mortgage that was taken out on this home.
Original Mortgage
$61,889
Interest Rate
4.25%
Mortgage Type
FHA
Purchase Details
Closed on
Dec 23, 2010
Sold by
American General Financial Services Inc
Bought by
Premier Homes Inc
Purchase Details
Closed on
Sep 27, 2010
Sold by
Larsen Richard A and Larsen Melissa L
Bought by
American General Financial Services Inc
Create a Home Valuation Report for This Property
The Home Valuation Report is an in-depth analysis detailing your home's value as well as a comparison with similar homes in the area
Home Values in the Area
Average Home Value in this Area
Purchase History
| Date | Buyer | Sale Price | Title Company |
|---|---|---|---|
| Parker Misty L | -- | None Available | |
| Arnold Kyle W | -- | None Available | |
| Premier Homes Inc | -- | -- | |
| American General Financial Services Inc | -- | -- |
Source: Public Records
Mortgage History
| Date | Status | Borrower | Loan Amount |
|---|---|---|---|
| Open | Parker Misty L | $72,485 | |
| Previous Owner | Arnold Kyle W | $61,889 |
Source: Public Records
Tax History Compared to Growth
Tax History
| Year | Tax Paid | Tax Assessment Tax Assessment Total Assessment is a certain percentage of the fair market value that is determined by local assessors to be the total taxable value of land and additions on the property. | Land | Improvement |
|---|---|---|---|---|
| 2024 | $949 | $90,600 | $10,900 | $79,700 |
| 2023 | $910 | $87,200 | $10,900 | $76,300 |
| 2022 | $834 | $80,200 | $10,900 | $69,300 |
| 2021 | $575 | $60,700 | $11,200 | $49,500 |
| 2020 | $534 | $59,600 | $11,000 | $48,600 |
| 2019 | $523 | $58,500 | $10,800 | $47,700 |
| 2018 | $729 | $56,600 | $10,400 | $46,200 |
| 2017 | $471 | $55,400 | $10,300 | $45,100 |
| 2016 | $554 | $55,400 | $10,300 | $45,100 |
| 2014 | $533 | $53,300 | $10,200 | $43,100 |
| 2013 | $533 | $52,500 | $10,000 | $42,500 |
Source: Public Records
Map
Nearby Homes
- 2605 S 10th St
- 2401 S 10th St
- 644 Helen Ave
- 2400 S 6th St
- 1141 E Voorhees St
- 2023 S 8th St
- 3375 S 3rd St
- 2800 S 13th St
- 1828 S 8th St
- 0 S Us Highway 41
- 1325 S 13 1 2 St
- 1801 S Center St
- 1325 E Margaret Dr
- 1925 S 4th St
- 1726 S 11th St
- 2531 S 1st St
- 3020 S 13th St
- 1709 S Center St
- 1604 S 5th St
- 2600 Thompson St