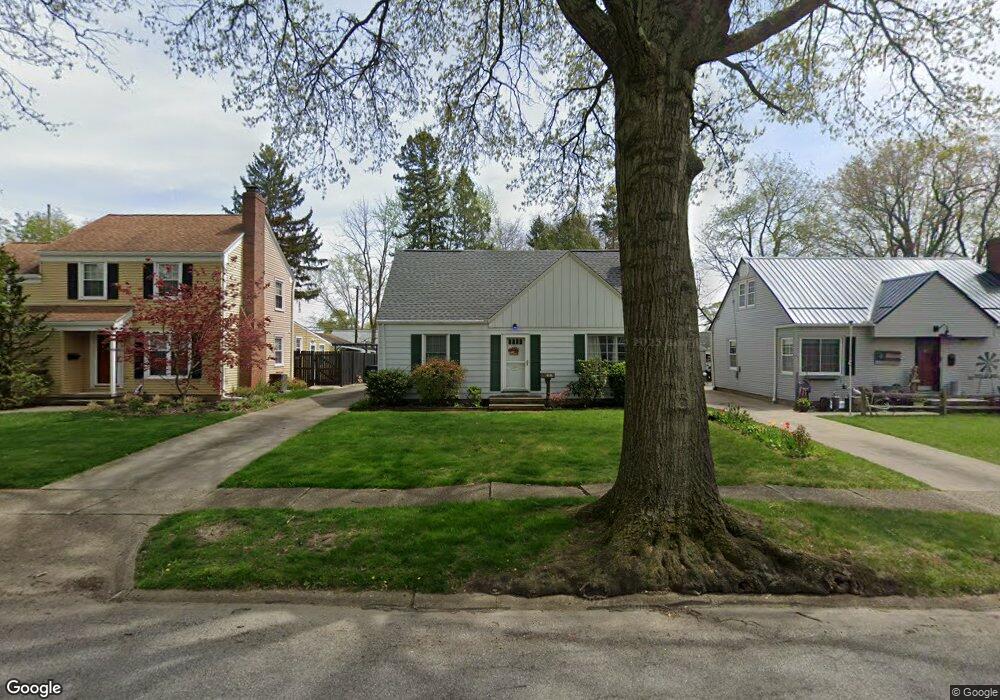
2505 14th St Cuyahoga Falls, OH 44223
Phelps Avenue NeighborhoodEstimated Value: $177,000 - $240,000
3
Beds
2
Baths
768
Sq Ft
$279/Sq Ft
Est. Value
About This Home
This home is located at 2505 14th St, Cuyahoga Falls, OH 44223 and is currently estimated at $214,399, approximately $279 per square foot. 2505 14th St is a home located in Summit County with nearby schools including Dewitt Elementary School, Bolich Middle School, and Cuyahoga Falls High School.
Ownership History
Date
Name
Owned For
Owner Type
Purchase Details
Closed on
Aug 5, 2005
Sold by
Hewitt Relocation Services Inc
Bought by
Greenberg Karen E
Current Estimated Value
Home Financials for this Owner
Home Financials are based on the most recent Mortgage that was taken out on this home.
Original Mortgage
$114,100
Outstanding Balance
$60,477
Interest Rate
5.8%
Mortgage Type
Purchase Money Mortgage
Estimated Equity
$153,922
Purchase Details
Closed on
Jul 5, 2005
Sold by
Hazard Ken R
Bought by
Hewitt Relocation Services Inc
Home Financials for this Owner
Home Financials are based on the most recent Mortgage that was taken out on this home.
Original Mortgage
$114,100
Outstanding Balance
$60,477
Interest Rate
5.8%
Mortgage Type
Purchase Money Mortgage
Estimated Equity
$153,922
Purchase Details
Closed on
Jul 19, 2002
Sold by
Showen Woodrow H and Showen Mary
Bought by
Hazard Ken R
Home Financials for this Owner
Home Financials are based on the most recent Mortgage that was taken out on this home.
Original Mortgage
$130,550
Interest Rate
6.79%
Mortgage Type
VA
Create a Home Valuation Report for This Property
The Home Valuation Report is an in-depth analysis detailing your home's value as well as a comparison with similar homes in the area
Home Values in the Area
Average Home Value in this Area
Purchase History
| Date | Buyer | Sale Price | Title Company |
|---|---|---|---|
| Greenberg Karen E | $127,000 | Chicago Title Insurance Co | |
| Hewitt Relocation Services Inc | $127,000 | Chicago Title Insurance Co | |
| Hazard Ken R | $128,000 | Bond & Associates Title Agen |
Source: Public Records
Mortgage History
| Date | Status | Borrower | Loan Amount |
|---|---|---|---|
| Open | Greenberg Karen E | $114,100 | |
| Previous Owner | Hazard Ken R | $130,550 |
Source: Public Records
Tax History Compared to Growth
Tax History
| Year | Tax Paid | Tax Assessment Tax Assessment Total Assessment is a certain percentage of the fair market value that is determined by local assessors to be the total taxable value of land and additions on the property. | Land | Improvement |
|---|---|---|---|---|
| 2025 | $3,125 | $57,891 | $13,178 | $44,713 |
| 2024 | $3,125 | $57,891 | $13,178 | $44,713 |
| 2023 | $3,125 | $57,891 | $13,178 | $44,713 |
| 2022 | $2,895 | $43,558 | $9,835 | $33,723 |
| 2021 | $2,895 | $43,558 | $9,835 | $33,723 |
| 2020 | $2,848 | $43,560 | $9,840 | $33,720 |
| 2019 | $2,705 | $37,690 | $9,430 | $28,260 |
| 2018 | $2,297 | $37,690 | $9,430 | $28,260 |
| 2017 | $2,267 | $37,690 | $9,430 | $28,260 |
| 2016 | $2,268 | $37,690 | $9,430 | $28,260 |
| 2015 | $2,267 | $37,690 | $9,430 | $28,260 |
| 2014 | $2,268 | $37,690 | $9,430 | $28,260 |
| 2013 | $2,250 | $37,720 | $9,430 | $28,290 |
Source: Public Records
Map
Nearby Homes