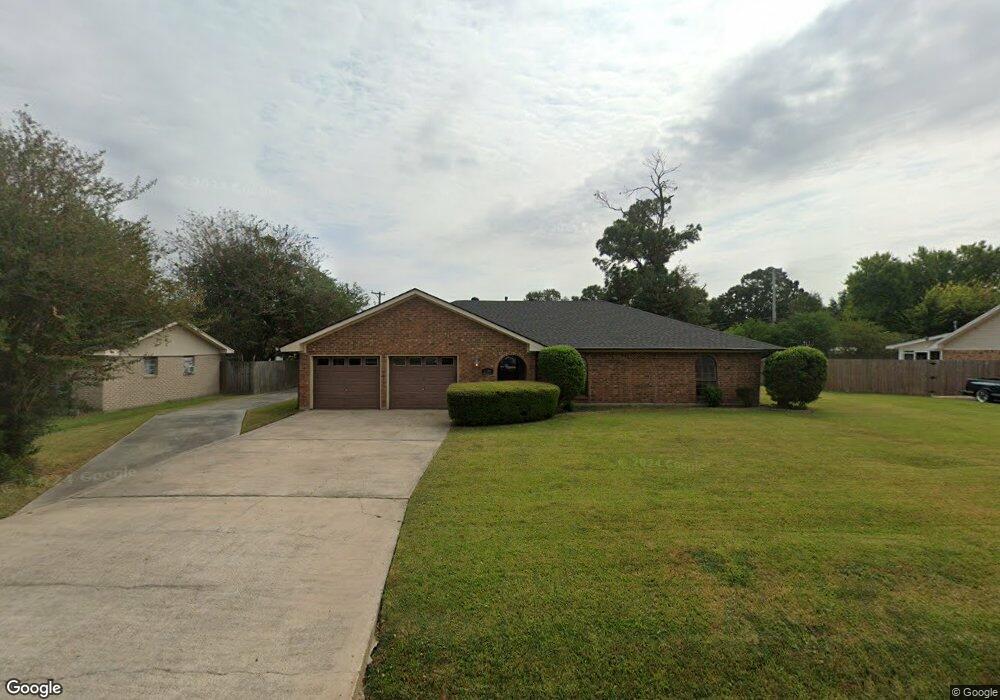
2505 8th St Port Neches, TX 77651
Estimated Value: $255,000 - $275,000
3
Beds
2
Baths
1,767
Sq Ft
$148/Sq Ft
Est. Value
About This Home
This home is located at 2505 8th St, Port Neches, TX 77651 and is currently estimated at $261,709, approximately $148 per square foot. 2505 8th St is a home located in Jefferson County with nearby schools including Nederland High School.
Ownership History
Date
Name
Owned For
Owner Type
Purchase Details
Closed on
May 20, 2024
Sold by
Roy Gregory Dale and Roy Denton Charles
Bought by
Fountain Lantz Davis
Current Estimated Value
Home Financials for this Owner
Home Financials are based on the most recent Mortgage that was taken out on this home.
Original Mortgage
$188,000
Outstanding Balance
$185,334
Interest Rate
6.82%
Mortgage Type
New Conventional
Estimated Equity
$76,375
Purchase Details
Closed on
Feb 11, 2011
Sold by
Roy Brent Steven
Bought by
Roy Gregory Dale
Create a Home Valuation Report for This Property
The Home Valuation Report is an in-depth analysis detailing your home's value as well as a comparison with similar homes in the area
Home Values in the Area
Average Home Value in this Area
Purchase History
| Date | Buyer | Sale Price | Title Company |
|---|---|---|---|
| Fountain Lantz Davis | -- | Capital Title | |
| Roy Gregory Dale | -- | None Available |
Source: Public Records
Mortgage History
| Date | Status | Borrower | Loan Amount |
|---|---|---|---|
| Open | Fountain Lantz Davis | $188,000 |
Source: Public Records
Tax History Compared to Growth
Tax History
| Year | Tax Paid | Tax Assessment Tax Assessment Total Assessment is a certain percentage of the fair market value that is determined by local assessors to be the total taxable value of land and additions on the property. | Land | Improvement |
|---|---|---|---|---|
| 2025 | $6,895 | $287,835 | $47,040 | $240,795 |
| 2024 | $6,895 | $287,835 | $47,040 | $240,795 |
| 2023 | $6,895 | $237,288 | $0 | $0 |
| 2022 | $3,282 | $215,716 | $0 | $0 |
| 2021 | $3,216 | $242,411 | $29,400 | $213,011 |
| 2020 | $3,075 | $199,966 | $29,400 | $170,566 |
| 2019 | $4,184 | $162,070 | $29,400 | $132,670 |
| 2018 | $2,772 | $155,750 | $29,400 | $126,350 |
| 2017 | $2,862 | $165,540 | $29,400 | $136,140 |
| 2016 | $4,109 | $165,540 | $29,400 | $136,140 |
| 2015 | $3,322 | $158,730 | $29,400 | $129,330 |
| 2014 | $3,322 | $158,730 | $29,400 | $129,330 |
Source: Public Records
Map
Nearby Homes