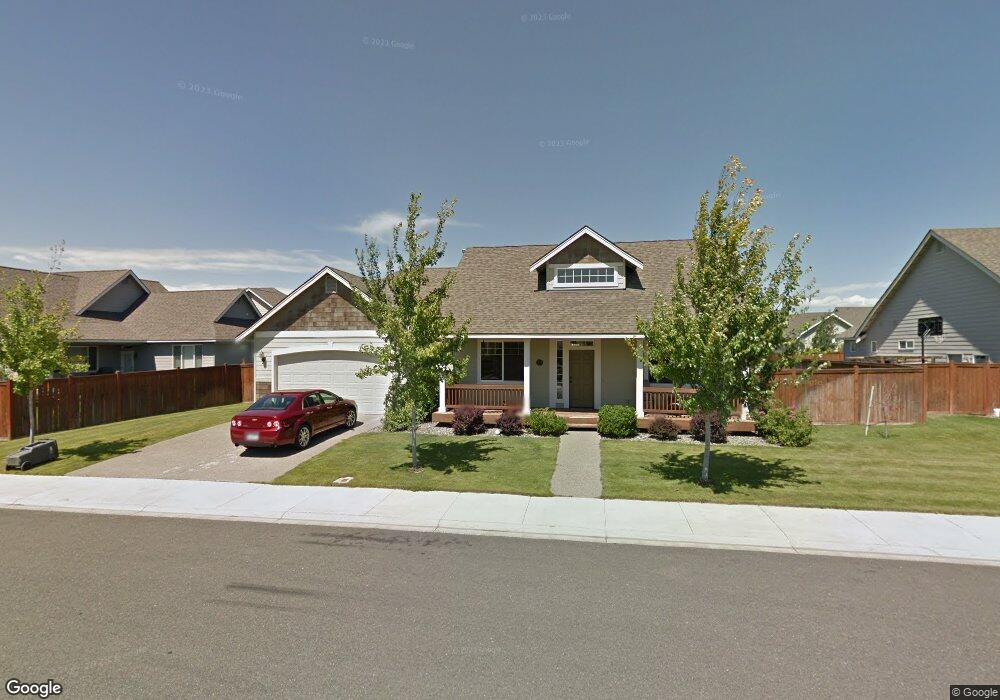
2505 Carriage Loop Ellensburg, WA 98926
Estimated Value: $497,281 - $626,000
3
Beds
2
Baths
1,665
Sq Ft
$325/Sq Ft
Est. Value
About This Home
This home is located at 2505 Carriage Loop, Ellensburg, WA 98926 and is currently estimated at $541,570, approximately $325 per square foot. 2505 Carriage Loop is a home located in Kittitas County with nearby schools including Creative Kids Learning Center and Ellensburg Christian School.
Ownership History
Date
Name
Owned For
Owner Type
Purchase Details
Closed on
Nov 5, 2009
Sold by
Stingley Ruley P and Stingley Annette M
Bought by
Paul Brantley T and Mccoy Paul Diann L
Current Estimated Value
Purchase Details
Closed on
Mar 24, 2006
Sold by
Shaw Rusty J and Shaw Kristin E
Bought by
Stingley Annette M and Stingley Ruley P
Home Financials for this Owner
Home Financials are based on the most recent Mortgage that was taken out on this home.
Original Mortgage
$49,600
Interest Rate
6.25%
Mortgage Type
Stand Alone Second
Purchase Details
Closed on
Jun 7, 2005
Sold by
Town & Country Homes Llc
Bought by
Shaw Rusty J and Shaw Kristin E
Home Financials for this Owner
Home Financials are based on the most recent Mortgage that was taken out on this home.
Original Mortgage
$184,455
Interest Rate
5.72%
Mortgage Type
New Conventional
Create a Home Valuation Report for This Property
The Home Valuation Report is an in-depth analysis detailing your home's value as well as a comparison with similar homes in the area
Home Values in the Area
Average Home Value in this Area
Purchase History
| Date | Buyer | Sale Price | Title Company |
|---|---|---|---|
| Paul Brantley T | $242,500 | Amerititle | |
| Stingley Annette M | $248,000 | Amerititle | |
| Shaw Rusty J | $207,223 | Amerititle |
Source: Public Records
Mortgage History
| Date | Status | Borrower | Loan Amount |
|---|---|---|---|
| Previous Owner | Stingley Annette M | $49,600 | |
| Previous Owner | Shaw Rusty J | $184,455 |
Source: Public Records
Tax History Compared to Growth
Tax History
| Year | Tax Paid | Tax Assessment Tax Assessment Total Assessment is a certain percentage of the fair market value that is determined by local assessors to be the total taxable value of land and additions on the property. | Land | Improvement |
|---|---|---|---|---|
| 2025 | $9,021 | $477,990 | $133,900 | $344,090 |
| 2023 | $4,511 | $434,080 | $104,070 | $330,010 |
| 2022 | $4,050 | $361,120 | $80,920 | $280,200 |
| 2021 | $3,956 | $333,620 | $67,940 | $265,680 |
| 2019 | $3,418 | $278,810 | $50,960 | $227,850 |
| 2018 | $3,038 | $261,220 | $50,960 | $210,260 |
| 2017 | $2,983 | $214,370 | $38,570 | $175,800 |
| 2016 | $2,884 | $214,370 | $38,570 | $175,800 |
| 2015 | $2,742 | $214,370 | $38,570 | $175,800 |
| 2013 | -- | $214,370 | $38,570 | $175,800 |
Source: Public Records
Map
Nearby Homes
- 2513 Dandelion Ln
- 2519 Dandelion Ln
- 1108 E Twilight Ln
- 809 E White Birch Ave
- 810 E White Birch Ave
- 1011 E 19th Ave Unit A&B
- 501 E Country Side Ave
- 400 E 24th Ave
- 2510 N Spar Ln
- 405 E Chason Ave
- 402 E Heatherstone Ct
- 400 E Heatherstone Ct
- 3118 Roundup Dr
- 3118 Roundup Dr Unit 179
- 300 E Country Side Ave
- 2209 N Spar Ln
- 2908 N Yale Ct
- 116 E Bender Rd Unit 1 & 2
- 305 E Stanford Ave
- 2304 N Ellington St
- 2503 Carriage Loop
- 2511 Carriage Loop
- 2515 Carriage Loop
- 2531 Carriage Loop
- 2525 Carriage Loop
- 2533 Carriage Loop
- 2504 Carriage Loop
- 2506 Carriage Loop
- 2502 Carriage Loop
- 2501 Carriage Loop
- 2508 Carriage Loop
- 2500 Carriage Loop
- 2535 Carriage Loop
- 2510 Carriage Loop
- 2530 Carriage Loop
- 2522 Carriage Loop
- 2532 Carriage Loop
- 1015 E Greenfield Ave
- 1021 E Greenfield Ave
- 2528 Carriage Loop