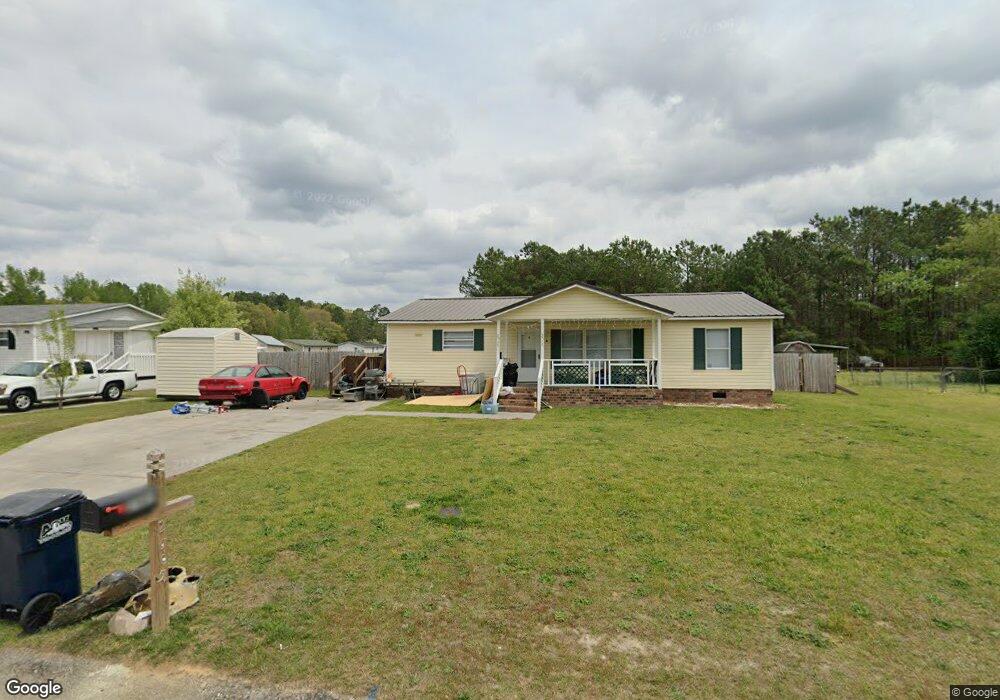
2505 Danahey Dr Raeford, NC 28376
Estimated Value: $64,022 - $132,000
3
Beds
2
Baths
1,080
Sq Ft
$89/Sq Ft
Est. Value
About This Home
This home is located at 2505 Danahey Dr, Raeford, NC 28376 and is currently estimated at $96,256, approximately $89 per square foot. 2505 Danahey Dr is a home located in Hoke County with nearby schools including Upchurch Elementary School, East Hoke Middle, and Hoke County High.
Ownership History
Date
Name
Owned For
Owner Type
Purchase Details
Closed on
Dec 2, 2021
Sold by
Payne Joann
Bought by
Guerrero Luis and De Guerrero Melissa
Current Estimated Value
Purchase Details
Closed on
Dec 7, 2020
Sold by
Payne Joann
Bought by
Guerrero Luis and Fajardo Melissa Castillo
Home Financials for this Owner
Home Financials are based on the most recent Mortgage that was taken out on this home.
Original Mortgage
$40,000
Interest Rate
2.8%
Mortgage Type
Land Contract Argmt. Of Sale
Purchase Details
Closed on
Oct 25, 2012
Sold by
N Touch Wireless Inc
Bought by
Payne Joann
Purchase Details
Closed on
Aug 7, 2012
Sold by
Caldwell Randall Wayne
Bought by
N Touch Wireless Inc
Purchase Details
Closed on
Oct 12, 2010
Sold by
Branch Banking And Trust Co
Bought by
Caldwell Randall Wayne
Home Financials for this Owner
Home Financials are based on the most recent Mortgage that was taken out on this home.
Original Mortgage
$28,430
Interest Rate
4.39%
Create a Home Valuation Report for This Property
The Home Valuation Report is an in-depth analysis detailing your home's value as well as a comparison with similar homes in the area
Home Values in the Area
Average Home Value in this Area
Purchase History
| Date | Buyer | Sale Price | Title Company |
|---|---|---|---|
| Guerrero Luis | $50,000 | None Available | |
| Guerrero Luis | $50,000 | None Available | |
| Payne Joann | $27,000 | None Available | |
| N Touch Wireless Inc | $29,082 | None Available | |
| Caldwell Randall Wayne | $28,000 | -- |
Source: Public Records
Mortgage History
| Date | Status | Borrower | Loan Amount |
|---|---|---|---|
| Previous Owner | Guerrero Luis | $40,000 | |
| Previous Owner | Caldwell Randall Wayne | $28,430 |
Source: Public Records
Tax History Compared to Growth
Tax History
| Year | Tax Paid | Tax Assessment Tax Assessment Total Assessment is a certain percentage of the fair market value that is determined by local assessors to be the total taxable value of land and additions on the property. | Land | Improvement |
|---|---|---|---|---|
| 2025 | $571 | $54,470 | $20,000 | $34,470 |
| 2024 | $571 | $54,470 | $20,000 | $34,470 |
| 2023 | $571 | $54,470 | $20,000 | $34,470 |
| 2022 | $562 | $54,470 | $20,000 | $34,470 |
| 2021 | $0 | $44,330 | $10,000 | $34,330 |
| 2020 | $496 | $44,330 | $10,000 | $34,330 |
| 2019 | $496 | $44,330 | $10,000 | $34,330 |
| 2018 | $496 | $44,330 | $10,000 | $34,330 |
| 2017 | $496 | $44,330 | $10,000 | $34,330 |
| 2016 | $489 | $44,330 | $10,000 | $34,330 |
| 2015 | $489 | $44,330 | $10,000 | $34,330 |
| 2014 | $469 | $44,330 | $10,000 | $34,330 |
| 2013 | -- | $58,840 | $19,000 | $39,840 |
Source: Public Records
Map
Nearby Homes
- 1504 Clan Campbell Dr
- 520 Inverary Dr
- 2910 Donegal Dr
- 2639 O'Glesby Dr
- 2913 Donegal Dr
- 129 Calvert Ct
- 1531 Clan Campbell Dr
- 562 Southerland Peak Dr
- 594 Southerland Peak Dr
- 578 Southerland Peak Dr
- 634 Southerland Peak Dr
- 1813 O'Bannon Dr
- 620 Southerland Peak Dr
- 1809 Obannon Dr
- 1410 Darby Dr
- 704 Southerland Peak Dr
- 680 Southerland Peak Dr
- 690 Southerland Peak Dr
- 2507 Danahey Dr
- 2503 Danahey Dr
- 2509 Danahey Dr
- 2411 Ohara Dr
- 2413 Ohara Dr
- 2413 O'Hara Dr
- 2504 Danahey Dr
- 2411 O'Hara Dr
- 2502 Danahey Dr
- 2506 Danahey Dr
- 2409 Ohara Dr
- 2511 Danahey Dr
- 2415 O'Hara Dr
- 2508 Danahey Dr
- 2415 Ohara Dr
- 2409 O'Hara Dr
- 2407 Ohara Dr
- 2510 Danahey Dr
- 2513 Danahey Dr
- 2414 O'Hara Dr