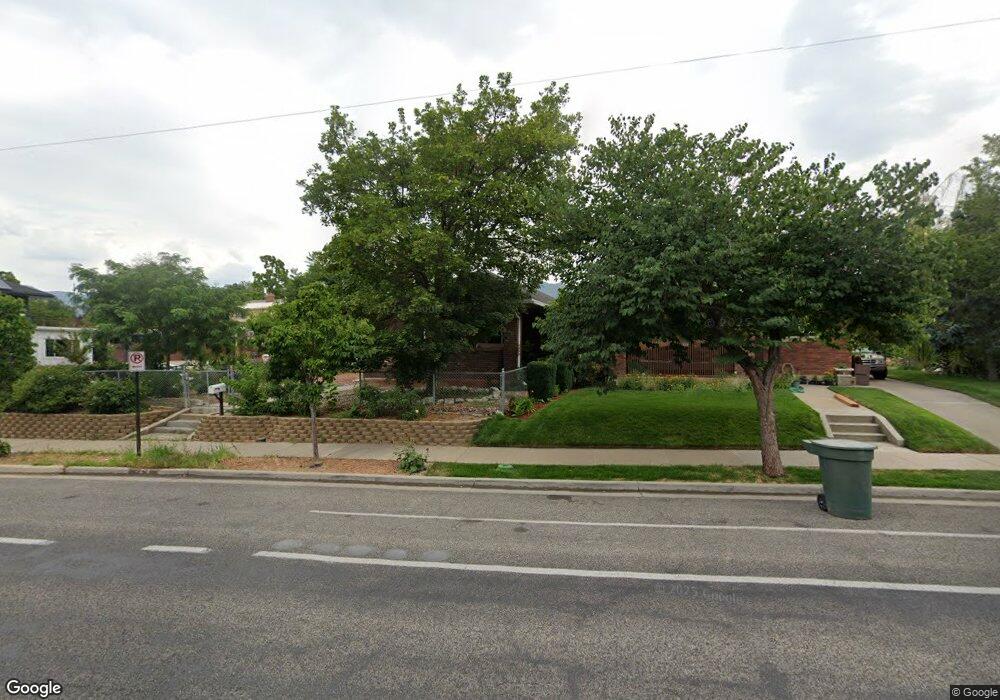
2505 Highland Dr Salt Lake City, UT 84106
Sugar House NeighborhoodEstimated Value: $608,000 - $672,230
3
Beds
2
Baths
2,261
Sq Ft
$286/Sq Ft
Est. Value
About This Home
This home is located at 2505 Highland Dr, Salt Lake City, UT 84106 and is currently estimated at $647,308, approximately $286 per square foot. 2505 Highland Dr is a home located in Salt Lake County with nearby schools including Nibley Park School, Highland High School, and Carden Memorial School.
Ownership History
Date
Name
Owned For
Owner Type
Purchase Details
Closed on
Feb 21, 2023
Sold by
Patterson Sean and Patterson Tram
Bought by
Np Full House Llc
Current Estimated Value
Purchase Details
Closed on
Nov 21, 2016
Sold by
Patterson Sean Eric
Bought by
Patterson Sean Eric and Nguyen Tram
Home Financials for this Owner
Home Financials are based on the most recent Mortgage that was taken out on this home.
Original Mortgage
$216,000
Interest Rate
3.57%
Mortgage Type
New Conventional
Purchase Details
Closed on
Nov 5, 2014
Sold by
Patterson Sean and Cornwall Collette
Bought by
Patterson Scan Eric
Home Financials for this Owner
Home Financials are based on the most recent Mortgage that was taken out on this home.
Original Mortgage
$173,500
Interest Rate
4.1%
Mortgage Type
New Conventional
Purchase Details
Closed on
May 26, 2011
Sold by
The Secretary Of Housing & Urban Develop
Bought by
Patterson Sean and Cornwall Collette
Home Financials for this Owner
Home Financials are based on the most recent Mortgage that was taken out on this home.
Original Mortgage
$182,911
Interest Rate
4.75%
Mortgage Type
FHA
Purchase Details
Closed on
Feb 9, 2011
Sold by
Wells Fargo Bank Na
Bought by
Secretary Of Housing & Urban Development
Purchase Details
Closed on
May 10, 2010
Sold by
Carter Landon A
Bought by
Wells Fargo Bank Na
Purchase Details
Closed on
Aug 1, 2007
Sold by
Carter Amber D
Bought by
Carter Landon A
Home Financials for this Owner
Home Financials are based on the most recent Mortgage that was taken out on this home.
Original Mortgage
$349,900
Interest Rate
6.62%
Mortgage Type
New Conventional
Purchase Details
Closed on
Jul 5, 2006
Sold by
Johnson Gerald B and Johnson Christine M
Bought by
Carter Amber D
Home Financials for this Owner
Home Financials are based on the most recent Mortgage that was taken out on this home.
Original Mortgage
$207,900
Interest Rate
6.63%
Mortgage Type
New Conventional
Purchase Details
Closed on
Apr 24, 2001
Sold by
Hayes Deanna V
Bought by
Johnson Gerald B and Johnson Christine M
Home Financials for this Owner
Home Financials are based on the most recent Mortgage that was taken out on this home.
Original Mortgage
$120,000
Interest Rate
6.98%
Purchase Details
Closed on
Jun 28, 1995
Sold by
Hayes Deanna V
Bought by
Hayes Deanna
Home Financials for this Owner
Home Financials are based on the most recent Mortgage that was taken out on this home.
Original Mortgage
$79,000
Interest Rate
7.9%
Create a Home Valuation Report for This Property
The Home Valuation Report is an in-depth analysis detailing your home's value as well as a comparison with similar homes in the area
Home Values in the Area
Average Home Value in this Area
Purchase History
| Date | Buyer | Sale Price | Title Company |
|---|---|---|---|
| Np Full House Llc | -- | -- | |
| Patterson Sean Eric | -- | Boston National Title Llc | |
| Patterson Scan Eric | -- | Meridian Title | |
| Patterson Sean | -- | Monument Title Ins Co | |
| Secretary Of Housing & Urban Development | -- | Backman Title Services | |
| Wells Fargo Bank Na | $387,616 | Etitle Insurance Agency | |
| Carter Landon A | -- | Wasatch Title Ins Agency Llc | |
| Carter Amber D | -- | Us Title Of Utah | |
| Johnson Gerald B | -- | Paramount Title | |
| Hayes Deanna | -- | -- |
Source: Public Records
Mortgage History
| Date | Status | Borrower | Loan Amount |
|---|---|---|---|
| Previous Owner | Patterson Sean Eric | $216,000 | |
| Previous Owner | Patterson Scan Eric | $173,500 | |
| Previous Owner | Patterson Sean | $182,911 | |
| Previous Owner | Carter Landon A | $349,900 | |
| Previous Owner | Carter Amber D | $207,900 | |
| Previous Owner | Johnson Gerald B | $120,000 | |
| Previous Owner | Hayes Deanna | $79,000 |
Source: Public Records
Tax History Compared to Growth
Tax History
| Year | Tax Paid | Tax Assessment Tax Assessment Total Assessment is a certain percentage of the fair market value that is determined by local assessors to be the total taxable value of land and additions on the property. | Land | Improvement |
|---|---|---|---|---|
| 2025 | $2,384 | $573,000 | $160,100 | $412,900 |
| 2024 | $2,384 | $454,800 | $151,600 | $303,200 |
| 2023 | $2,274 | $418,200 | $152,200 | $266,000 |
| 2022 | $2,496 | $430,700 | $149,200 | $281,500 |
| 2021 | $2,393 | $373,800 | $114,000 | $259,800 |
| 2020 | $2,418 | $359,600 | $101,800 | $257,800 |
| 2019 | $2,462 | $344,400 | $94,000 | $250,400 |
| 2018 | $2,002 | $272,700 | $94,000 | $178,700 |
| 2017 | $2,038 | $260,100 | $94,000 | $166,100 |
| 2016 | $1,974 | $239,300 | $79,000 | $160,300 |
| 2015 | $1,980 | $227,500 | $77,400 | $150,100 |
| 2014 | $1,903 | $216,900 | $75,800 | $141,100 |
Source: Public Records
Map
Nearby Homes
- 1214 E Parkway Ave
- 2477 S Douglas St
- 1168 E Parkway Ave
- 2430 S Elizabeth St Unit 5
- 2400 S Elizabeth St Unit 4
- 2438 S Elizabeth St Unit 2
- 2584 S Elizabeth St Unit 5
- 2594 S Elizabeth St
- 2710 S Highland Dr Unit 11
- 1192 E 2700 S
- 1130 E 2700 S Unit K83
- 1150 E 2700 S Unit G51
- 1150 E 2700 S Unit 50G
- 2760 S Highland Dr Unit 21
- 2760 S Highland Dr Unit 20
- 1152 E 2700 S Unit S148
- 1201 E Wilmington Ave Unit 206
- 876 Forest Park Ct
- 2865 S 1335 E
- 1314 E Crandall Ave
- 2505 S Highland Dr
- 2509 S Highland Dr
- 2509 Highland Dr
- 1224 E Warnock Ave
- 1224 Warnock Ave
- 2515 S Highland Dr
- 2515 S Highland Dr Unit A
- 2515 Highland Dr
- 2485 Highland Dr
- 2485 S Highland Dr
- 1232 Warnock Ave
- 2481 Highland Dr
- 1219 E Warnock Ave
- 2523 S Highland Dr
- 2523 Highland Dr
- 1225 E Warnock Ave
- 1225 Warnock Ave
- 2510 S Highland Dr1200 E
- 2510 Highland Dr
- 2510 S Highland Dr