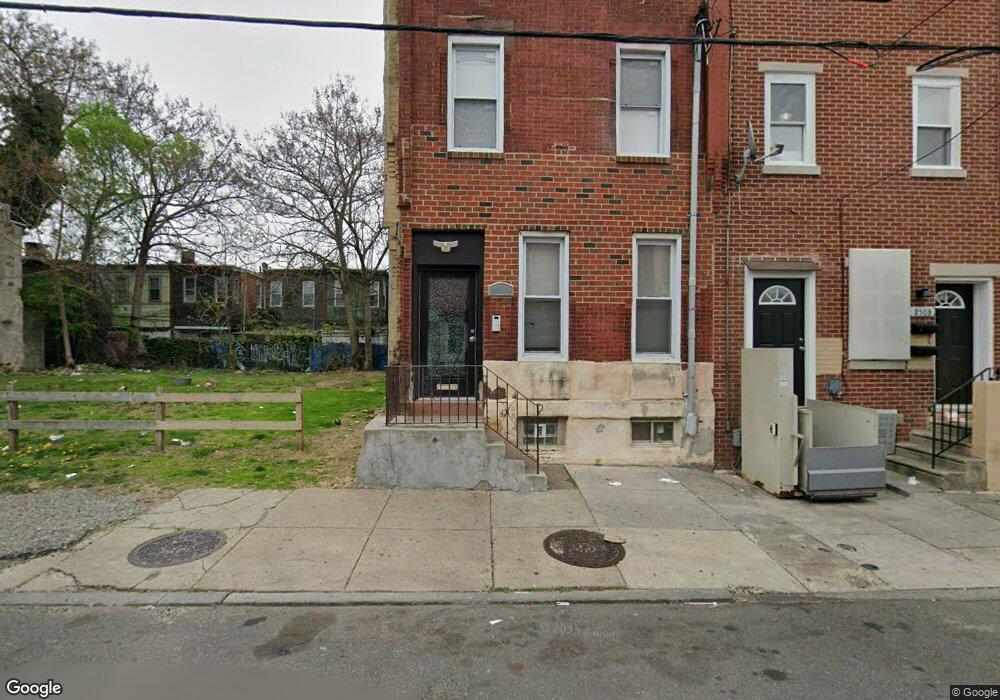
2505 N 17th St Philadelphia, PA 19132
North Philadelphia West NeighborhoodEstimated Value: $176,000 - $654,456
--
Bed
3
Baths
1,980
Sq Ft
$195/Sq Ft
Est. Value
About This Home
This home is located at 2505 N 17th St, Philadelphia, PA 19132 and is currently estimated at $385,364, approximately $194 per square foot. 2505 N 17th St is a home located in Philadelphia County with nearby schools including Tanner Duckrey School, Kipp North Philadelphia Academy, and Tech Freire Charter School.
Ownership History
Date
Name
Owned For
Owner Type
Purchase Details
Closed on
Jul 16, 2020
Sold by
N Superior Contracting Llc
Bought by
Gaisby Entertajnment Llc
Current Estimated Value
Home Financials for this Owner
Home Financials are based on the most recent Mortgage that was taken out on this home.
Original Mortgage
$375,000
Outstanding Balance
$332,525
Interest Rate
3.1%
Mortgage Type
Unknown
Estimated Equity
$52,839
Purchase Details
Closed on
Dec 5, 2018
Sold by
Nelson Mantaya and Feggins Jean
Bought by
N Superior Contracting Llc
Purchase Details
Closed on
Oct 2, 2017
Sold by
Monopoly Bro Investments Llc
Bought by
N Superior Contracting Llc
Purchase Details
Closed on
Mar 2, 2015
Sold by
Feggins Jean and Estate Of James Turner
Bought by
Monopoly Bro Investments Llc
Purchase Details
Closed on
Sep 18, 1969
Bought by
James Turner and Helen Maner As
Create a Home Valuation Report for This Property
The Home Valuation Report is an in-depth analysis detailing your home's value as well as a comparison with similar homes in the area
Home Values in the Area
Average Home Value in this Area
Purchase History
| Date | Buyer | Sale Price | Title Company |
|---|---|---|---|
| Gaisby Entertajnment Llc | $500,000 | Attorney S Choice Abstract C | |
| N Superior Contracting Llc | -- | America Advantage Abstract L | |
| N Superior Contracting Llc | $5,500 | None Available | |
| Monopoly Bro Investments Llc | $1,500 | None Available | |
| James Turner | -- | -- |
Source: Public Records
Mortgage History
| Date | Status | Borrower | Loan Amount |
|---|---|---|---|
| Open | Gaisby Entertajnment Llc | $375,000 |
Source: Public Records
Tax History Compared to Growth
Tax History
| Year | Tax Paid | Tax Assessment Tax Assessment Total Assessment is a certain percentage of the fair market value that is determined by local assessors to be the total taxable value of land and additions on the property. | Land | Improvement |
|---|---|---|---|---|
| 2025 | $3,003 | $261,400 | $52,280 | $209,120 |
| 2024 | $3,003 | $261,400 | $52,280 | $209,120 |
| 2023 | $3,003 | $214,500 | $42,900 | $171,600 |
| 2022 | $4,042 | $214,500 | $42,900 | $171,600 |
| 2021 | $153 | $0 | $0 | $0 |
| 2020 | $153 | $0 | $0 | $0 |
| 2019 | $148 | $0 | $0 | $0 |
| 2018 | $412 | $0 | $0 | $0 |
| 2017 | $412 | $0 | $0 | $0 |
| 2016 | $412 | $0 | $0 | $0 |
| 2015 | $427 | $0 | $0 | $0 |
| 2014 | -- | $31,900 | $3,859 | $28,041 |
| 2012 | -- | $2,592 | $347 | $2,245 |
Source: Public Records
Map
Nearby Homes
- 2525 N 17th St
- 2515 N Chadwick St
- 2531 N Colorado St
- 2540 N 17th St
- 2534 N Bancroft St
- 2471 N Colorado St
- 2535 N Bouvier St
- 2456 N Colorado St
- 2536 N 16th St
- 2543 N Bouvier St
- 2538 N 16th St
- 2445 N Bancroft St
- 2458 N 16th St
- 2448 N Colorado St
- 616 W Huntingdon St
- 624 W Huntingdon St
- 2566 N Bancroft St
- 2433 N 17th St
- 2432 N 17th St
- 1714 W Huntingdon St
- 2507 N 17th St
- 2503 N 17th St
- 2509 N 17th St
- 2511 N 17th St
- 2504 N Chadwick St
- 2506 N Chadwick St
- 2513 N 17th St
- 2508 N Chadwick St
- 2502 N Chadwick St
- 2510 N Chadwick St
- 2515 N 17th St
- 2512 N Chadwick St
- 2517 N 17th St
- 2514 N Chadwick St
- 2519 N 17th St
- 2516 N Chadwick St
- 2504 N 17th St
- 2518 N Chadwick St
- 1629 W Cumberland St
- 2510 N 17th St