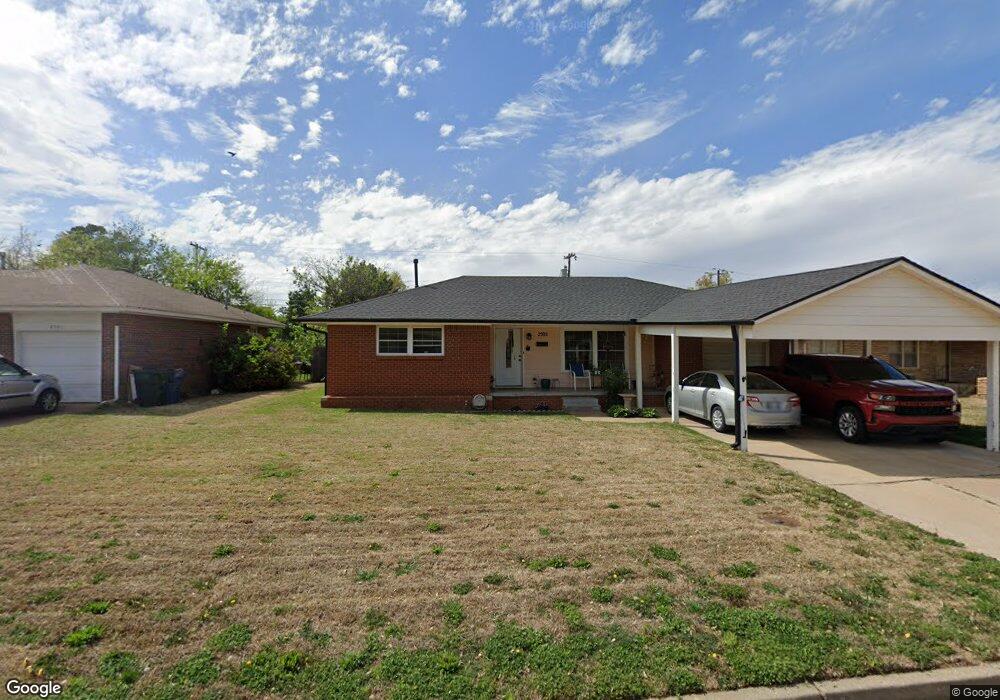
2505 N Thornton Dr Oklahoma City, OK 73110
Estimated Value: $139,000 - $156,000
3
Beds
1
Bath
1,048
Sq Ft
$140/Sq Ft
Est. Value
About This Home
This home is located at 2505 N Thornton Dr, Oklahoma City, OK 73110 and is currently estimated at $146,697, approximately $139 per square foot. 2505 N Thornton Dr is a home located in Oklahoma County with nearby schools including Midwest City Middle School, Midwest City High School, and Insight School of Oklahoma High School.
Ownership History
Date
Name
Owned For
Owner Type
Purchase Details
Closed on
Nov 30, 2011
Sold by
Swails Stacy R
Bought by
Mccoy Randall Forrest
Current Estimated Value
Home Financials for this Owner
Home Financials are based on the most recent Mortgage that was taken out on this home.
Original Mortgage
$79,921
Outstanding Balance
$54,985
Interest Rate
4.13%
Mortgage Type
FHA
Estimated Equity
$91,712
Purchase Details
Closed on
Sep 28, 2005
Sold by
Warlick Chris and Warlick Beajaye
Bought by
Swails Stacy R
Home Financials for this Owner
Home Financials are based on the most recent Mortgage that was taken out on this home.
Original Mortgage
$73,348
Interest Rate
5.65%
Mortgage Type
FHA
Purchase Details
Closed on
Mar 9, 2001
Sold by
Warlick Chris and Warlick Beajaye
Bought by
Warlick Chris and Warlick Beajaye
Purchase Details
Closed on
May 18, 1999
Sold by
Everett Helen B
Bought by
Hall Darla R and Everett Helen B
Create a Home Valuation Report for This Property
The Home Valuation Report is an in-depth analysis detailing your home's value as well as a comparison with similar homes in the area
Home Values in the Area
Average Home Value in this Area
Purchase History
| Date | Buyer | Sale Price | Title Company |
|---|---|---|---|
| Mccoy Randall Forrest | $82,000 | Stewart Escrow & Title Midwe | |
| Swails Stacy R | $74,500 | Capitol Abstract & Title | |
| Warlick Chris | -- | Capitol Abstract & Title Co | |
| Warlick Chris | $58,000 | -- | |
| Hall Darla R | -- | -- | |
| Hall Darla R | -- | -- |
Source: Public Records
Mortgage History
| Date | Status | Borrower | Loan Amount |
|---|---|---|---|
| Open | Mccoy Randall Forrest | $79,921 | |
| Previous Owner | Swails Stacy R | $73,348 |
Source: Public Records
Tax History Compared to Growth
Tax History
| Year | Tax Paid | Tax Assessment Tax Assessment Total Assessment is a certain percentage of the fair market value that is determined by local assessors to be the total taxable value of land and additions on the property. | Land | Improvement |
|---|---|---|---|---|
| 2024 | $1,141 | $11,017 | $1,707 | $9,310 |
| 2023 | $1,141 | $10,697 | $1,532 | $9,165 |
| 2022 | $1,095 | $10,385 | $1,613 | $8,772 |
| 2021 | $1,085 | $10,083 | $1,831 | $8,252 |
| 2020 | $1,079 | $9,790 | $2,008 | $7,782 |
| 2019 | $1,027 | $9,743 | $1,582 | $8,161 |
| 2018 | $932 | $9,460 | $0 | $0 |
| 2017 | $941 | $9,404 | $1,670 | $7,734 |
| 2016 | $942 | $9,184 | $1,670 | $7,514 |
| 2015 | $965 | $9,054 | $1,787 | $7,267 |
| 2014 | $932 | $8,790 | $1,808 | $6,982 |
Source: Public Records
Map
Nearby Homes
- 2409 N Towry Dr
- 705 E Bouse Dr
- 620 E Bouse Dr
- 809 General Senter Dr
- 2104 Clary Dr
- 717 S Midwest Blvd
- 1125 Tall Oaks Dr
- 3200 N Holman Ct
- 617 Holman Place
- 409 N Midwest Blvd
- 2121 Stevens Dr
- 2109 Stevens Dr
- 2903 Del Casa Cir
- 509 E Kerr Dr
- 225 Randall Dr
- 216 Gill Dr
- 125 Gill Dr
- 3321 Brookside Dr
- 3405 Sycamore Dr
- 737 E Steed Dr
- 2501 N Thornton Dr
- 2509 N Thornton Dr
- 2425 N Thornton Dr
- 2513 N Thornton Dr
- 2504 N Thornton Dr
- 2500 N Thornton Dr
- 2508 N Thornton Dr
- 2512 N Thornton Dr
- 2421 N Thornton Dr
- 2428 N Thornton Dr
- 704 E Carroll Ln
- 2424 N Thornton Dr
- 2601 N Thornton Dr
- 2417 N Thornton Dr
- 741 E Bouse Dr
- 2420 N Thornton Dr
- 737 E Bouse Dr
- 708 E Carroll Ln
- 8032 E Reno Ave
- 2605 N Thornton Dr