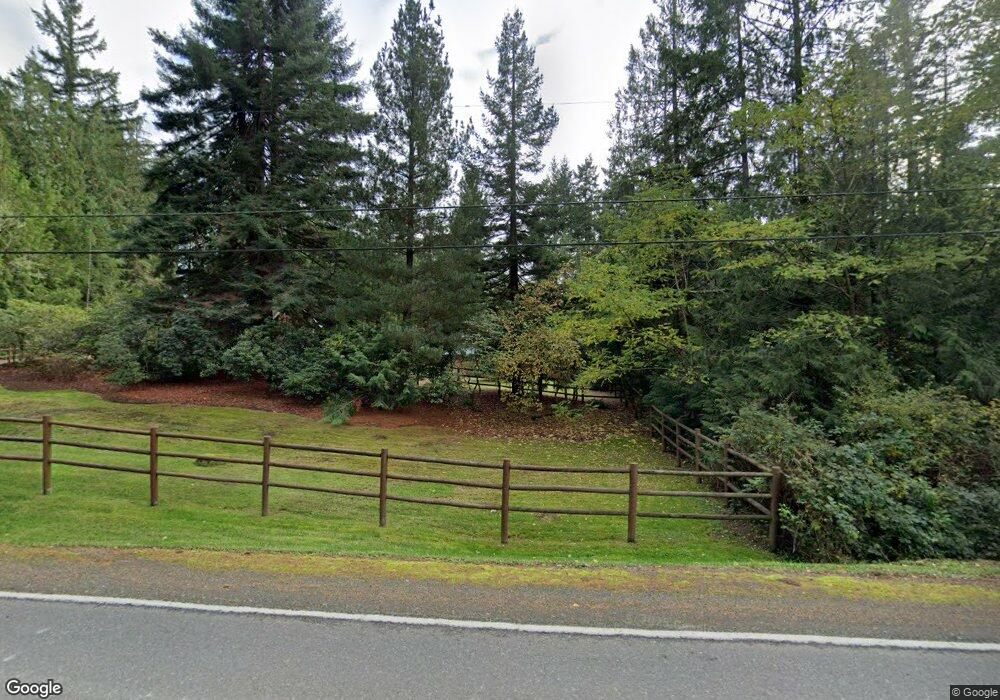
2505 NW Rude Rd Poulsbo, WA 98370
Estimated Value: $459,000 - $539,912
2
Beds
1
Bath
1,033
Sq Ft
$486/Sq Ft
Est. Value
About This Home
This home is located at 2505 NW Rude Rd, Poulsbo, WA 98370 and is currently estimated at $501,728, approximately $485 per square foot. 2505 NW Rude Rd is a home located in Kitsap County with nearby schools including Vinland Elementary School, Poulsbo Middle School, and North Kitsap High School.
Ownership History
Date
Name
Owned For
Owner Type
Purchase Details
Closed on
May 15, 2020
Sold by
Huff Jason R and Huff Karma K
Bought by
Huff Jason R
Current Estimated Value
Purchase Details
Closed on
Feb 20, 2001
Sold by
Huff Jason R
Bought by
Huff Jason R and Huff Karma K
Home Financials for this Owner
Home Financials are based on the most recent Mortgage that was taken out on this home.
Original Mortgage
$108,800
Outstanding Balance
$38,741
Interest Rate
6.89%
Estimated Equity
$462,987
Purchase Details
Closed on
Oct 28, 1997
Sold by
Carlson Henry A and Carlson Martha D
Bought by
Huff Jason R
Home Financials for this Owner
Home Financials are based on the most recent Mortgage that was taken out on this home.
Original Mortgage
$109,356
Interest Rate
7.3%
Mortgage Type
FHA
Purchase Details
Closed on
Aug 14, 1997
Sold by
Winmar Of Kitsap Inc
Bought by
Carlson Martha D
Create a Home Valuation Report for This Property
The Home Valuation Report is an in-depth analysis detailing your home's value as well as a comparison with similar homes in the area
Home Values in the Area
Average Home Value in this Area
Purchase History
| Date | Buyer | Sale Price | Title Company |
|---|---|---|---|
| Huff Jason R | -- | Accommodation | |
| Huff Jason R | -- | Land Title Company | |
| Huff Jason R | $110,000 | Transnation Title Insurance | |
| Carlson Martha D | -- | -- |
Source: Public Records
Mortgage History
| Date | Status | Borrower | Loan Amount |
|---|---|---|---|
| Open | Huff Jason R | $108,800 | |
| Closed | Huff Jason R | $109,356 |
Source: Public Records
Tax History Compared to Growth
Tax History
| Year | Tax Paid | Tax Assessment Tax Assessment Total Assessment is a certain percentage of the fair market value that is determined by local assessors to be the total taxable value of land and additions on the property. | Land | Improvement |
|---|---|---|---|---|
| 2026 | $3,836 | $426,520 | $196,500 | $230,020 |
| 2025 | $3,836 | $426,520 | $196,500 | $230,020 |
| 2024 | $3,089 | $352,160 | $155,300 | $196,860 |
| 2023 | $3,137 | $352,160 | $155,300 | $196,860 |
| 2022 | $2,722 | $288,960 | $129,230 | $159,730 |
| 2021 | $2,782 | $274,100 | $121,630 | $152,470 |
| 2020 | $2,709 | $263,020 | $116,200 | $146,820 |
| 2019 | $2,556 | $247,350 | $108,600 | $138,750 |
| 2018 | $2,213 | $187,820 | $90,500 | $97,320 |
| 2017 | $2,180 | $187,820 | $90,500 | $97,320 |
| 2016 | $2,256 | $179,330 | $90,500 | $88,830 |
| 2015 | $2,198 | $175,940 | $90,500 | $85,440 |
| 2014 | -- | $171,980 | $90,500 | $81,480 |
| 2013 | -- | $171,980 | $90,500 | $81,480 |
Source: Public Records
Map
Nearby Homes
- 1881 Claret Loop NW
- 21555 Urdahl Rd NW
- 1906 NW Nahele Ct Unit 52
- 21728 Urdahl Rd NW
- 1851 NW Nahele Ct Unit 57
- 21756 Windmill Loop NW
- 1845 NW Nahele Ct Unit 58
- 1839 NW Nahele Ct Unit 59
- 1888 NW Nahele Ct Unit 49
- 1864 NW Nahele Ct Unit 63
- 1858 NW Nahele Ct Unit 64
- 1852 NW Nahele Ct Unit 65
- 1876 NW Nahele Ct Unit 61
- 1846 NW Nahele Ct Unit 66
- 1840 NW Nahele Ct Unit 67
- 1963 NW Meadowview Dr
- 1963 NW Meadowview Dr Unit 43
- Plan 2925 at Winslow Ridge
- Plan 2330 at Winslow Ridge
- Plan 2755 at Winslow Ridge
- 2540 NW Rude Rd
- 20959 Seaport Place NW
- 2296 NW Rude Rd
- 2338 NW Rude Rd
- 2588 NW Rude Rd
- 2492 NW Rude Rd
- 20929 Seaport Place NW
- 20989 Seaport Place NW
- 2718 NW Rude Rd
- 2727 NW Rude Rd
- 2182 NW Rude Rd
- 21484 Clear Creek Rd NW
- 2735 NW Rude Rd
- 20900 Seaport Place NW
- 2414 NW Back Forty Ln
- 2376 Back Forty Ln NW
- 20990 Seaport Place NW
- 2464 NW Rude Rd
- 2746 NW Rude Rd
- 2402 NW Back Forty Ln