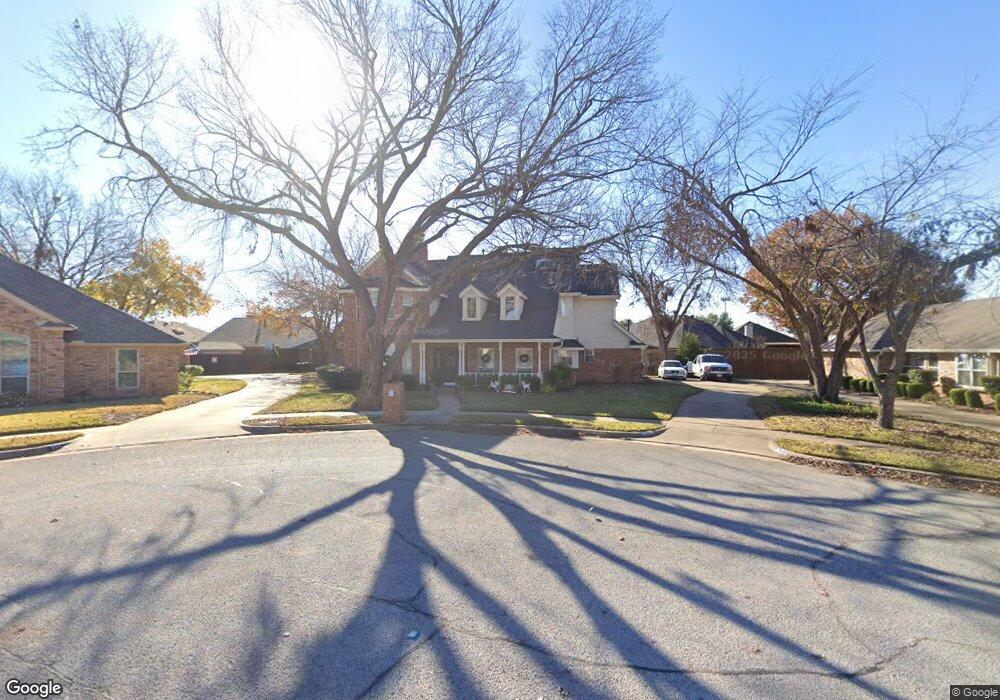
2505 Rollingshire Ct Bedford, TX 76021
Estimated Value: $513,000 - $567,000
4
Beds
3
Baths
2,856
Sq Ft
$187/Sq Ft
Est. Value
About This Home
This home is located at 2505 Rollingshire Ct, Bedford, TX 76021 and is currently estimated at $534,956, approximately $187 per square foot. 2505 Rollingshire Ct is a home located in Tarrant County with nearby schools including Shady Brook Elementary School, Harwood Junior High School, and Trinity High School.
Ownership History
Date
Name
Owned For
Owner Type
Purchase Details
Closed on
Jun 26, 2020
Sold by
Madsen Louise Catherine and Madsen Raymond John
Bought by
Pittard Michael G and Pittard Meagan
Current Estimated Value
Home Financials for this Owner
Home Financials are based on the most recent Mortgage that was taken out on this home.
Original Mortgage
$284,000
Outstanding Balance
$252,300
Interest Rate
3.2%
Mortgage Type
New Conventional
Estimated Equity
$282,656
Purchase Details
Closed on
Nov 20, 2009
Sold by
Narramore Jimmy Charles and Narramore Deborah Sue
Bought by
Madsen Louise Catherine and Madsen Raymond John
Home Financials for this Owner
Home Financials are based on the most recent Mortgage that was taken out on this home.
Original Mortgage
$196,000
Interest Rate
4.99%
Mortgage Type
New Conventional
Create a Home Valuation Report for This Property
The Home Valuation Report is an in-depth analysis detailing your home's value as well as a comparison with similar homes in the area
Home Values in the Area
Average Home Value in this Area
Purchase History
| Date | Buyer | Sale Price | Title Company |
|---|---|---|---|
| Pittard Michael G | -- | Ort | |
| Madsen Louise Catherine | -- | None Available |
Source: Public Records
Mortgage History
| Date | Status | Borrower | Loan Amount |
|---|---|---|---|
| Open | Pittard Michael G | $284,000 | |
| Previous Owner | Madsen Louise Catherine | $196,000 |
Source: Public Records
Tax History Compared to Growth
Tax History
| Year | Tax Paid | Tax Assessment Tax Assessment Total Assessment is a certain percentage of the fair market value that is determined by local assessors to be the total taxable value of land and additions on the property. | Land | Improvement |
|---|---|---|---|---|
| 2025 | $7,827 | $469,000 | $90,000 | $379,000 |
| 2024 | $7,827 | $512,679 | $90,000 | $422,679 |
| 2023 | $8,239 | $501,061 | $75,000 | $426,061 |
| 2022 | $8,529 | $486,278 | $75,000 | $411,278 |
| 2021 | $8,362 | $355,000 | $75,000 | $280,000 |
| 2020 | $8,516 | $369,766 | $75,000 | $294,766 |
| 2019 | $7,910 | $353,459 | $75,000 | $278,459 |
| 2018 | $5,363 | $296,014 | $75,000 | $221,014 |
| 2017 | $6,510 | $325,023 | $35,000 | $290,023 |
| 2016 | $5,918 | $296,578 | $35,000 | $261,578 |
| 2015 | $5,310 | $222,400 | $35,000 | $187,400 |
| 2014 | $5,310 | $222,400 | $35,000 | $187,400 |
Source: Public Records
Map
Nearby Homes
- 2112 Oakmeadow Place
- 1601 Warwickshire Ct W
- 2109 Oakmeadow St
- 2024 Oakmeadow St
- 2524 Shady Ridge Dr
- 22 Lincolnshire Cir
- 2503 Shady Ridge Dr
- 37 Devonshire Dr
- 1630 Post Oak Dr
- 1723 Post Oak Dr
- 31 Morrow Dr
- 2901 Miles Way
- 49 Morrow Dr
- 1704 Indian Oaks Ct
- 6 Park Ln
- 1636 Bedford Oaks Dr
- 18 Park Ln
- 1401 Danielle Dr
- 2220 Tiffany Glenn Ct
- 2508 Lakeview Dr
- 1812 Pine Ridge Dr
- 1901 Pine Ridge Dr
- 2509 Rollingshire Ct
- 2501 Rollingshire Ct
- 1905 Pine Ridge Dr
- 1808 Pine Ridge Dr
- 1909 Pine Ridge Dr
- 2513 Rollingshire Ct
- 2500 Rollingshire Ct
- 1805 Realistic Ct
- 1804 Pine Ridge Dr
- 2504 Rollingshire Ct
- 2508 Rollingshire Ct
- 1913 Pine Ridge Dr
- 2521 Sunshine Ct
- 1801 Realistic Ct
- 1900 Pine Ridge Dr
- 1809 Realistic Ct
- 1904 Pine Ridge Dr
- 1800 Pine Ridge Dr