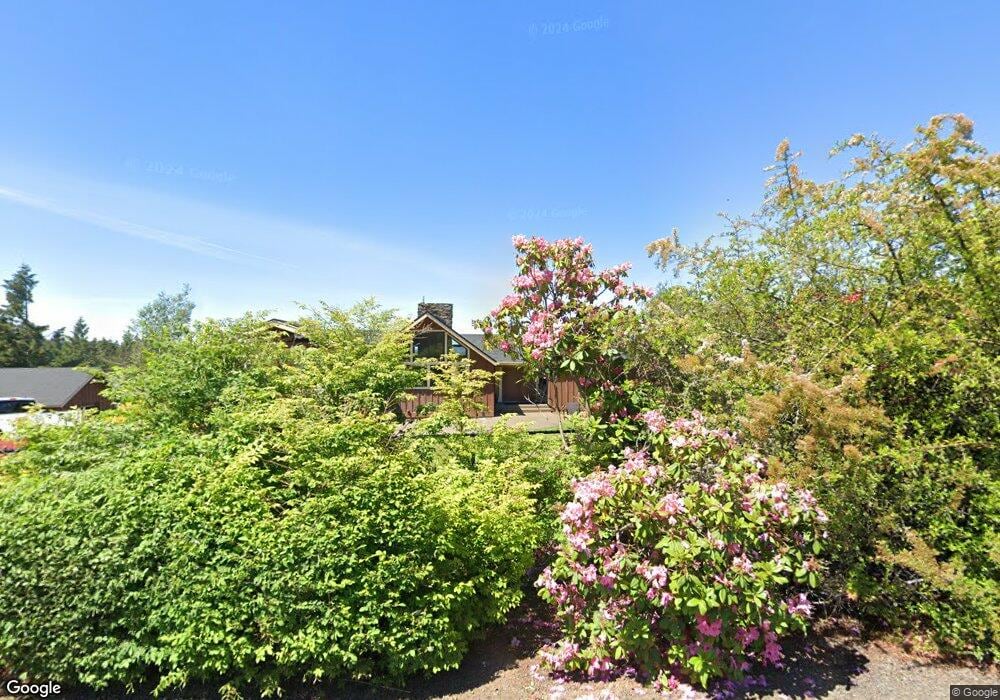
2505 SW Buckman Rd West Linn, OR 97068
Tualatin Valley NeighborhoodEstimated Value: $577,000 - $1,317,000
3
Beds
2
Baths
3,256
Sq Ft
$328/Sq Ft
Est. Value
About This Home
This home is located at 2505 SW Buckman Rd, West Linn, OR 97068 and is currently estimated at $1,068,786, approximately $328 per square foot. 2505 SW Buckman Rd is a home located in Clackamas County with nearby schools including Stafford Primary School, Wilsonville High School, and Three Rivers Charter School.
Ownership History
Date
Name
Owned For
Owner Type
Purchase Details
Closed on
Oct 14, 2022
Sold by
Rouse Jeffrey Dale
Bought by
Rouse Jeffrey Dale and Rouse Erin Jennings
Current Estimated Value
Home Financials for this Owner
Home Financials are based on the most recent Mortgage that was taken out on this home.
Original Mortgage
$1,200,000
Outstanding Balance
$159,859
Interest Rate
6.02%
Mortgage Type
New Conventional
Estimated Equity
$908,927
Purchase Details
Closed on
Nov 23, 2021
Sold by
Bloore Virginia Christine and Bond Kimberley Teri
Bought by
Rouse Jeffery Dale and Sorenson Erin Jennings
Home Financials for this Owner
Home Financials are based on the most recent Mortgage that was taken out on this home.
Original Mortgage
$348,750
Interest Rate
5.75%
Mortgage Type
New Conventional
Create a Home Valuation Report for This Property
The Home Valuation Report is an in-depth analysis detailing your home's value as well as a comparison with similar homes in the area
Home Values in the Area
Average Home Value in this Area
Purchase History
| Date | Buyer | Sale Price | Title Company |
|---|---|---|---|
| Rouse Jeffrey Dale | -- | Chicago Title | |
| Rouse Jeffery Dale | $465,000 | Fidelity National Ttl Of Or |
Source: Public Records
Mortgage History
| Date | Status | Borrower | Loan Amount |
|---|---|---|---|
| Open | Rouse Jeffrey Dale | $1,200,000 | |
| Previous Owner | Rouse Jeffery Dale | $348,750 |
Source: Public Records
Tax History Compared to Growth
Tax History
| Year | Tax Paid | Tax Assessment Tax Assessment Total Assessment is a certain percentage of the fair market value that is determined by local assessors to be the total taxable value of land and additions on the property. | Land | Improvement |
|---|---|---|---|---|
| 2025 | $17,239 | $994,348 | -- | -- |
| 2024 | $7,253 | $422,026 | -- | -- |
| 2023 | $7,253 | $323,527 | $0 | $0 |
| 2022 | $5,396 | $314,104 | $0 | $0 |
| 2021 | $5,106 | $304,956 | $0 | $0 |
| 2020 | $5,161 | $296,074 | $0 | $0 |
| 2019 | $4,912 | $287,451 | $0 | $0 |
| 2018 | $4,683 | $279,079 | $0 | $0 |
| 2017 | $4,457 | $270,950 | $0 | $0 |
| 2016 | $3,048 | $182,970 | $0 | $0 |
| 2015 | $7,532 | $460,984 | $0 | $0 |
| 2014 | $7,069 | $447,557 | $0 | $0 |
Source: Public Records
Map
Nearby Homes
- 2850 SW Turner Rd
- 22525 SW Stafford Rd
- 3990 SW Borland Rd
- 541 SW Ashdown Cir
- 1660 SW Royal Dr
- 2250 River Heights Cir
- 1550 SW Shadow Wood Dr
- 1550 Shadow Wood Dr
- 24800 SW Big Fir Rd
- 812 Wendy Ct
- 1101 Ryan Ct
- 20102 SW 54th Terrace
- 5275 SW Greenwood Cir
- 1075 Epperly Way
- 19200 SW 46th Ave
- 2420 Margery St
- 1160 Blankenship Rd
- 0 S Sweetbriar Rd Unit 23219494
- 00 Mountain Rd
- 19130 SW 51st Ave
- 2455 SW Buckman Rd
- 2717 Buckman Rd
- 2450 SW Buckman Rd
- 2425 SW Buckman Rd
- 2530 SW Buckman Rd
- 2395 SW Buckman Rd
- 2385 SW Buckman Rd
- 2509 Buckman Rd
- 2510 SW Buckman Rd
- 2351 SW Buckman Rd
- 2391 SW Buckman Rd
- 2911 SW Turner Rd
- 2333 SW Turner Rd
- 0 SW Turner Rd
- 21616 SW Athey Rd
- 21550 SW Athey Rd
- 2961 SW Turner Rd
- 2981 SW Buckman Rd
- 2981 SW Buckman Rd
- 2250 SW Turner Rd