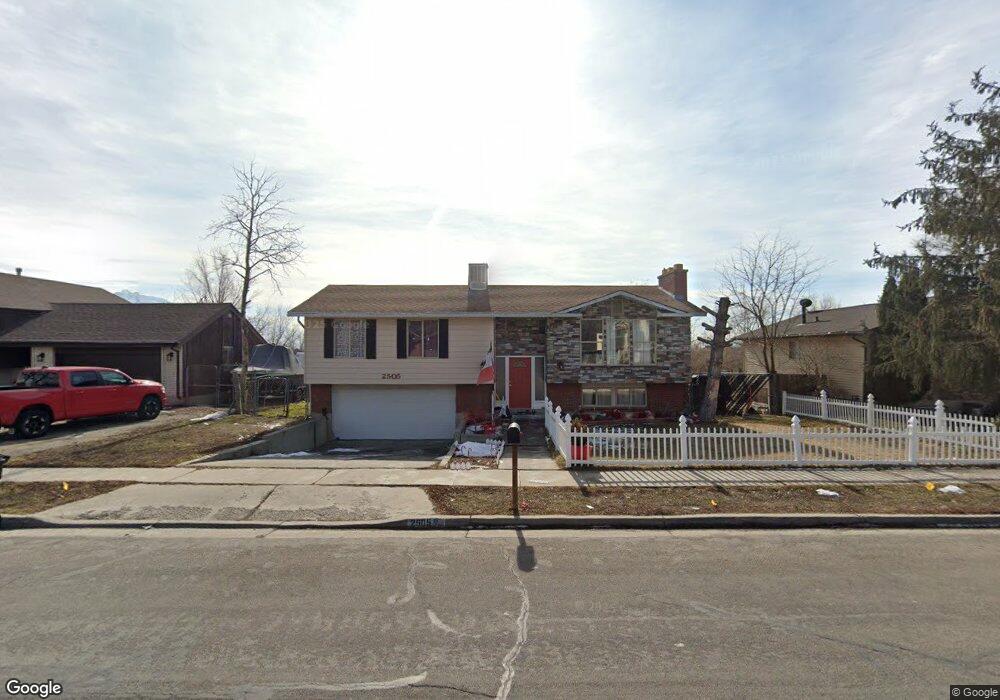
2505 W Ledgewood Dr Taylorsville, UT 84129
Estimated Value: $506,139 - $544,000
3
Beds
2
Baths
2,000
Sq Ft
$262/Sq Ft
Est. Value
About This Home
This home is located at 2505 W Ledgewood Dr, Taylorsville, UT 84129 and is currently estimated at $523,035, approximately $261 per square foot. 2505 W Ledgewood Dr is a home located in Salt Lake County with nearby schools including Calvin S Smith Elementary School, Bennion Junior High School, and Taylorsville High School.
Ownership History
Date
Name
Owned For
Owner Type
Purchase Details
Closed on
Jan 7, 2013
Sold by
Aubrey Investemnts Lc
Bought by
Williams Brian C
Current Estimated Value
Purchase Details
Closed on
Nov 12, 2009
Sold by
Gonzales Ben and Gonzales Karen C
Bought by
Aubrey Investments Lc
Purchase Details
Closed on
Aug 3, 2006
Sold by
Williams Brian C
Bought by
Gonzales Ben and Gonzales Karen C
Home Financials for this Owner
Home Financials are based on the most recent Mortgage that was taken out on this home.
Original Mortgage
$186,800
Interest Rate
6.7%
Mortgage Type
Unknown
Purchase Details
Closed on
May 12, 2005
Sold by
Wilkinson William J
Bought by
Williams Brian C
Create a Home Valuation Report for This Property
The Home Valuation Report is an in-depth analysis detailing your home's value as well as a comparison with similar homes in the area
Home Values in the Area
Average Home Value in this Area
Purchase History
| Date | Buyer | Sale Price | Title Company |
|---|---|---|---|
| Williams Brian C | -- | Accommodation | |
| Aubrey Investments Lc | -- | None Available | |
| Gonzales Ben | -- | Meridian Title | |
| Williams Brian C | -- | Surety Title |
Source: Public Records
Mortgage History
| Date | Status | Borrower | Loan Amount |
|---|---|---|---|
| Previous Owner | Gonzales Ben | $186,800 |
Source: Public Records
Tax History Compared to Growth
Tax History
| Year | Tax Paid | Tax Assessment Tax Assessment Total Assessment is a certain percentage of the fair market value that is determined by local assessors to be the total taxable value of land and additions on the property. | Land | Improvement |
|---|---|---|---|---|
| 2025 | -- | $470,100 | $145,700 | $324,400 |
| 2024 | -- | $454,600 | $140,800 | $313,800 |
| 2023 | $3,308 | $425,300 | $134,100 | $291,200 |
| 2022 | $3,012 | $431,800 | $131,500 | $300,300 |
| 2021 | $2,756 | $332,400 | $93,900 | $238,500 |
| 2020 | $3,405 | $292,900 | $93,900 | $199,000 |
| 2019 | $3,456 | $285,000 | $81,700 | $203,300 |
| 2018 | $2,349 | $265,600 | $81,700 | $183,900 |
| 2017 | $1,816 | $212,900 | $81,700 | $131,200 |
| 2016 | $1,834 | $192,700 | $81,700 | $111,000 |
| 2015 | $1,794 | $196,300 | $97,000 | $99,300 |
| 2014 | $1,532 | $178,200 | $89,200 | $89,000 |
Source: Public Records
Map
Nearby Homes
- 2449 W 6385 S
- 6474 Tamra Dr
- 2333 W Ledgewood Dr
- 2332 Broderick Dr
- 2250 W Tierra Rose Dr
- 6438 Mckinley Ln
- 2683 W Carson Ln Unit 12
- 6653 S 2200 W
- 6512 Timpanogos Way
- 2126 W Happiness Dr
- 2421 W 6900 S
- 2137 W 6200 S
- 2787 W 6870 S
- 3052 W Matterhorn Dr
- 6924 S 2160 W
- 6683 Alice Susanna Ln
- 6016 S Paprika Cir
- 3117 W 6250 S
- 6095 S Sierra Grande Dr
- 6855 S Running Springs Dr
- 2505 Ledgewood Dr
- 2505 S Ledgewood Dr
- 2491 S Ledgewood Dr
- 2519 Ledgewood Dr
- 2491 Ledgewood Dr
- 6469 Calnita Cir
- 2492 Tierra Rose Dr
- 2535 Ledgewood Dr
- 2477 Ledgewood Dr
- 2504 Ledgewood Dr
- 2520 Ledgewood Dr
- 2508 Tierra Rose Dr
- 2486 W Ledgewood Dr
- 2486 Ledgewood Dr
- 2474 Tierra Rose Dr
- 2540 Ledgewood Dr
- 2535 Ledgewood Dr
- 2551 W Ledgewood Dr
- 2551 Ledgewood Dr
- 2551 W Ledgewood Dr