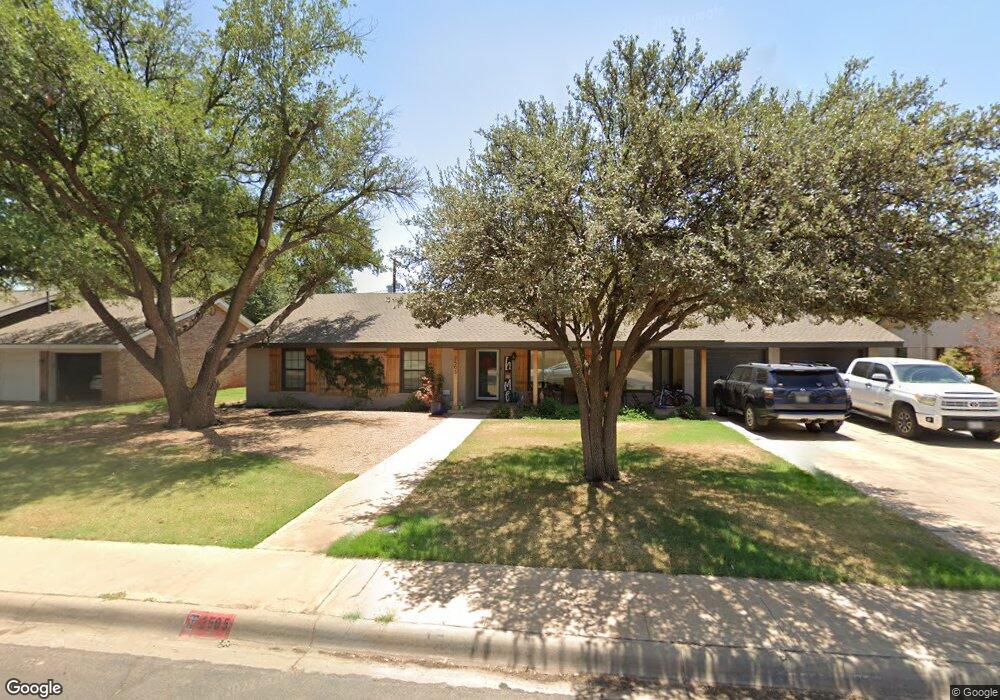
2505 W Shandon Ave Midland, TX 79705
Fannin Terrace NeighborhoodEstimated Value: $368,000 - $442,000
3
Beds
2
Baths
2,077
Sq Ft
$191/Sq Ft
Est. Value
About This Home
This home is located at 2505 W Shandon Ave, Midland, TX 79705 and is currently estimated at $396,252, approximately $190 per square foot. 2505 W Shandon Ave is a home located in Midland County with nearby schools including Fannin Elementary School, San Jacinto Junior High School, and Midland High School.
Ownership History
Date
Name
Owned For
Owner Type
Purchase Details
Closed on
Nov 8, 2024
Sold by
Frasier Eric Cole
Bought by
Rampton Ryan James and Rampton Kristin
Current Estimated Value
Home Financials for this Owner
Home Financials are based on the most recent Mortgage that was taken out on this home.
Original Mortgage
$346,500
Outstanding Balance
$342,696
Interest Rate
6.12%
Mortgage Type
New Conventional
Estimated Equity
$53,556
Purchase Details
Closed on
Dec 27, 2022
Sold by
Dewey James and Dewey Rita
Bought by
Cple Frazier Eric
Purchase Details
Closed on
May 31, 2006
Sold by
Stewart Robert Scott and Stewart Carmen Dyan
Bought by
Dean Ken
Purchase Details
Closed on
Nov 1, 2003
Bought by
Dean Ken Ttee
Purchase Details
Closed on
Oct 31, 1997
Bought by
Dean Ken Ttee
Purchase Details
Closed on
Dec 1, 1982
Bought by
Dean Ken Ttee
Create a Home Valuation Report for This Property
The Home Valuation Report is an in-depth analysis detailing your home's value as well as a comparison with similar homes in the area
Home Values in the Area
Average Home Value in this Area
Purchase History
| Date | Buyer | Sale Price | Title Company |
|---|---|---|---|
| Rampton Ryan James | -- | West Texas Abstract & Title | |
| Cple Frazier Eric | -- | -- | |
| Dean Ken | -- | None Available | |
| Dean Ken Ttee | -- | -- | |
| Dean Ken Ttee | -- | -- | |
| Dean Ken Ttee | -- | -- |
Source: Public Records
Mortgage History
| Date | Status | Borrower | Loan Amount |
|---|---|---|---|
| Open | Rampton Ryan James | $346,500 |
Source: Public Records
Tax History Compared to Growth
Tax History
| Year | Tax Paid | Tax Assessment Tax Assessment Total Assessment is a certain percentage of the fair market value that is determined by local assessors to be the total taxable value of land and additions on the property. | Land | Improvement |
|---|---|---|---|---|
| 2025 | $4,096 | $355,820 | $25,140 | $330,680 |
| 2024 | $4,102 | $270,110 | $25,140 | $244,970 |
| 2023 | $3,965 | $264,580 | $25,140 | $239,440 |
| 2022 | $4,886 | $251,510 | $25,140 | $226,370 |
| 2021 | $4,319 | $280,480 | $25,140 | $255,340 |
| 2020 | $4,319 | $249,240 | $25,140 | $224,100 |
| 2019 | $4,719 | $249,240 | $25,140 | $224,100 |
| 2018 | $4,492 | $231,010 | $25,140 | $205,870 |
| 2017 | $4,295 | $220,880 | $25,140 | $195,740 |
| 2016 | $4,320 | $221,790 | $25,140 | $196,650 |
| 2015 | -- | $221,790 | $25,140 | $196,650 |
| 2014 | -- | $211,360 | $0 | $0 |
Source: Public Records
Map
Nearby Homes
- 2601 W Dengar Ave
- 2502 Frontier Dr
- 2400 W Dengar Ave
- 2605 Inwood Ct
- 63 Ironwood Ct Unit 91
- 63 Ironwood Ct
- 2800 Cimmaron Ave
- 2305 W Shandon Ave
- 4 Amhurst Ct
- 2401 Dartmouth Dr
- 3 Marinor Ct
- 2515 Neely Ave
- 19 Winchester Ct
- 2500 Seaboard Ave
- 2603 Hughes St
- 2824 Cimmaron Ave
- 2503 Seaboard Ave
- 2409 Stutz Place
- 3304 Whitney Dr
- 2603 Hodges St
- 2507 W Shandon Ave
- 2503 W Shandon Ave
- 2504 W Dengar Ave
- 2502 W Dengar Ave
- 2506 W Dengar Ave
- 2504 W Shandon Ave
- 2509 W Shandon Ave
- 2501 W Shandon Ave
- 2506 W Shandon Ave
- 2502 W Shandon Ave
- 2500 W Dengar Ave
- 2508 W Dengar Ave
- 2500 W Shandon Ave
- 2508 W Shandon Ave
- 2511 W Shandon Ave
- 2505 W Dengar Ave
- 2505 Camarie Ave
- 2510 W Dengar Ave
- 2507 Camarie Ave
- 2503 W Dengar Ave