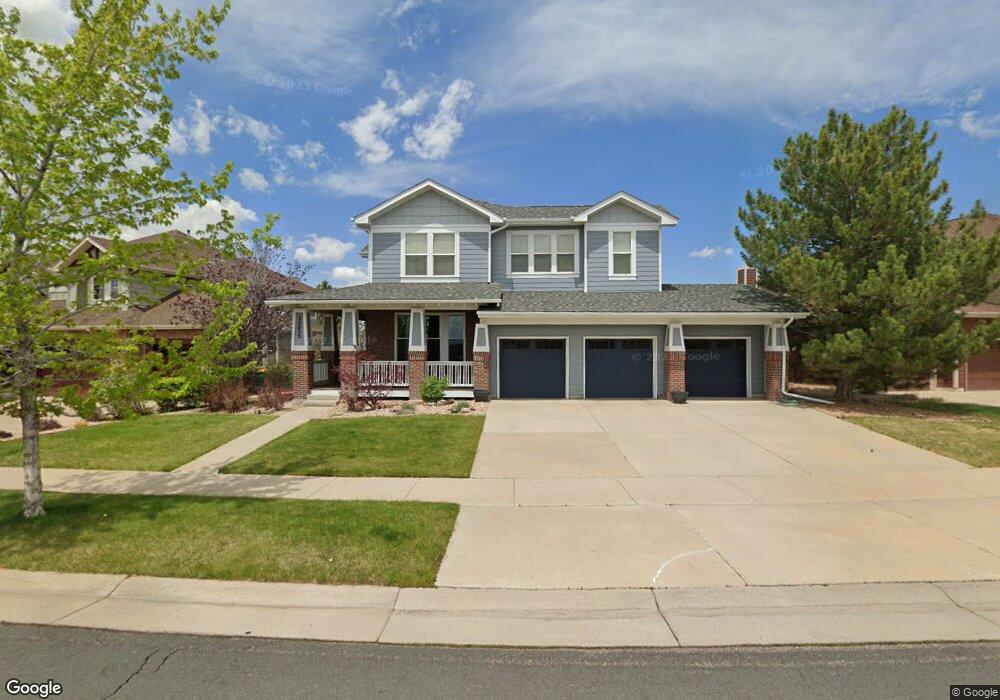
25055 E Park Crescent Dr Aurora, CO 80016
Tallyn's Reach NeighborhoodEstimated Value: $688,000 - $785,000
3
Beds
3
Baths
4,302
Sq Ft
$173/Sq Ft
Est. Value
About This Home
This home is located at 25055 E Park Crescent Dr, Aurora, CO 80016 and is currently estimated at $744,227, approximately $172 per square foot. 25055 E Park Crescent Dr is a home located in Arapahoe County with nearby schools including Black Forest Hills Elementary School, Fox Ridge Middle School, and Cherokee Trail High School.
Ownership History
Date
Name
Owned For
Owner Type
Purchase Details
Closed on
Apr 11, 2018
Sold by
Avendano Curiel Katherine M
Bought by
Katherine M Avendano Curiel Trust
Current Estimated Value
Purchase Details
Closed on
Dec 13, 2016
Sold by
Yi Woon Ho
Bought by
Avendano Curiel Jorge J and Avendano Curiel Katherine M
Home Financials for this Owner
Home Financials are based on the most recent Mortgage that was taken out on this home.
Original Mortgage
$323,200
Outstanding Balance
$259,069
Interest Rate
3.54%
Mortgage Type
New Conventional
Estimated Equity
$485,158
Purchase Details
Closed on
May 12, 2005
Sold by
Preserve Homes Llc
Bought by
Yi Woon Ho
Home Financials for this Owner
Home Financials are based on the most recent Mortgage that was taken out on this home.
Original Mortgage
$359,550
Interest Rate
5.92%
Mortgage Type
Fannie Mae Freddie Mac
Create a Home Valuation Report for This Property
The Home Valuation Report is an in-depth analysis detailing your home's value as well as a comparison with similar homes in the area
Home Values in the Area
Average Home Value in this Area
Purchase History
| Date | Buyer | Sale Price | Title Company |
|---|---|---|---|
| Katherine M Avendano Curiel Trust | -- | None Available | |
| Jorge J Avendano Curiel Trust | -- | None Available | |
| Avendano Curiel Jorge J | -- | None Available | |
| Avendano Curiel Jorge J | $431,000 | Legend Title | |
| Yi Woon Ho | $378,500 | Land Title Guarantee Company |
Source: Public Records
Mortgage History
| Date | Status | Borrower | Loan Amount |
|---|---|---|---|
| Open | Avendano Curiel Jorge J | $323,200 | |
| Previous Owner | Yi Woon Ho | $359,550 |
Source: Public Records
Tax History
| Year | Tax Paid | Tax Assessment Tax Assessment Total Assessment is a certain percentage of the fair market value that is determined by local assessors to be the total taxable value of land and additions on the property. | Land | Improvement |
|---|---|---|---|---|
| 2025 | $5,511 | $46,606 | -- | -- |
| 2024 | $4,996 | $47,007 | -- | -- |
| 2023 | $4,996 | $47,007 | $0 | $0 |
| 2022 | $4,382 | $37,154 | $0 | $0 |
| 2021 | $4,389 | $37,154 | $0 | $0 |
| 2020 | $4,905 | $38,682 | $0 | $0 |
| 2019 | $4,806 | $38,682 | $0 | $0 |
| 2018 | $3,973 | $30,960 | $0 | $0 |
| 2017 | $3,940 | $30,960 | $0 | $0 |
| 2016 | $4,076 | $32,111 | $0 | $0 |
| 2015 | $3,954 | $32,111 | $0 | $0 |
| 2014 | $3,589 | $27,048 | $0 | $0 |
| 2013 | -- | $26,770 | $0 | $0 |
Source: Public Records
Map
Nearby Homes
- 25203 E Indore Dr
- 7028 S Irvington Ct
- 24531 E Frost Dr
- 7234 S Kellerman Way
- 25412 E Quarto Place
- 25338 E Costilla Place
- 2132 S Irvington Ct
- 7034 S Fultondale Cir
- 24248 E Roxbury Cir
- 25983 E Geddes Cir
- 24622 E Ontario Dr
- 26053 E Geddes Cir
- 23953 E Roxbury Place
- 24031 E Hinsdale Place
- 24655 E Kettle Ct
- 24880 E Euclid Place
- 24595 E Kettle Ct
- 24515 E Kettle Ct
- 7370 S Catawba Way
- 24564 E Kettle Ct
- 25065 E Park Crescent Dr
- 25098 E Roxbury Place
- 25035 E Park Crescent Dr
- 25088 E Roxbury Place
- 22542 E Indore Dr
- 25078 E Roxbury Place
- 25025 E Park Crescent Dr
- 25107 E Park Crescent Dr
- 7140 S Ider Ct
- 25068 E Roxbury Place
- 25093 E Roxbury Place
- 25117 E Park Crescent Dr
- 25083 E Roxbury Place
- 7130 S Ider Ct
- 25058 E Roxbury Place
- 25073 E Roxbury Place
- 25005 E Park Crescent Dr
- 25127 E Park Crescent Dr
- 7137 S Ider Ct
- 7293 S Irvington Ct
Your Personal Tour Guide
Ask me questions while you tour the home.