Estimated Value: $191,000 - $212,000
3
Beds
2
Baths
1,086
Sq Ft
$187/Sq Ft
Est. Value
About This Home
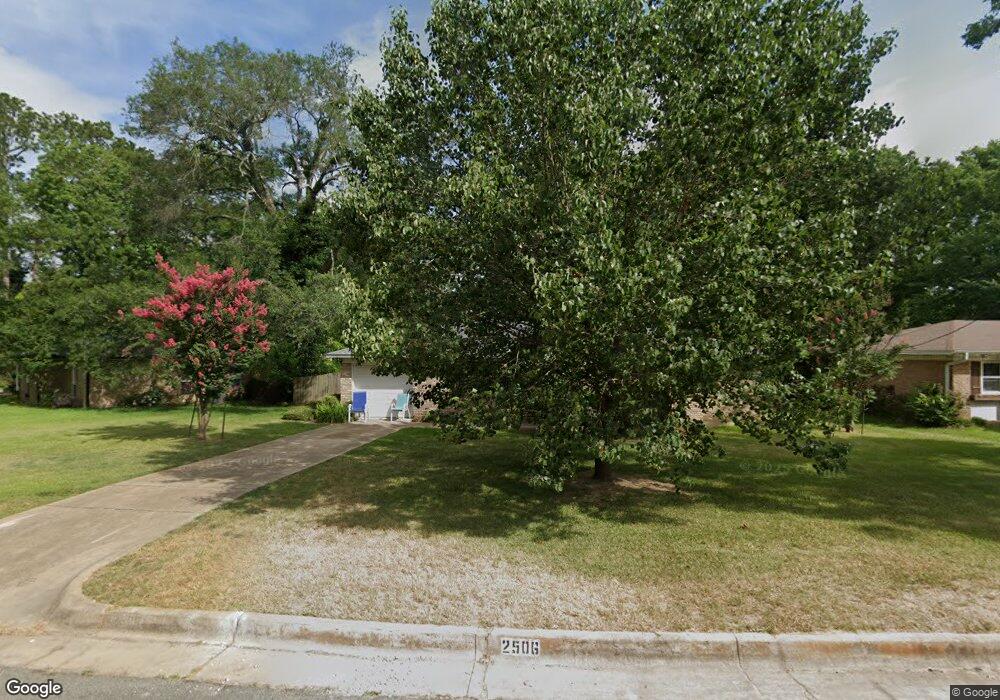
This home is located at 2506 2506 Marilyn, Tyler, TX 75701 and is currently estimated at $202,981, approximately $186 per square foot. 2506 2506 Marilyn is a home located in Smith County with nearby schools including Clarkston Elementary School, Hubbard Middle School, and Tyler Legacy High School.
Ownership History
Date
Name
Owned For
Owner Type
Purchase Details
Closed on
Feb 5, 2024
Sold by
Read Royce
Bought by
Jones Vicki Lea
Current Estimated Value
Home Financials for this Owner
Home Financials are based on the most recent Mortgage that was taken out on this home.
Original Mortgage
$109,998
Outstanding Balance
$107,837
Interest Rate
6.61%
Mortgage Type
New Conventional
Estimated Equity
$95,144
Purchase Details
Closed on
Jul 7, 2015
Sold by
Conley Casey H
Bought by
Read Jacqueline L
Purchase Details
Closed on
May 17, 2005
Sold by
Mcgraw Joseph W and Pinkerton Mcgraw Katie L
Bought by
Conley Casey H
Home Financials for this Owner
Home Financials are based on the most recent Mortgage that was taken out on this home.
Original Mortgage
$80,000
Interest Rate
7.68%
Mortgage Type
Adjustable Rate Mortgage/ARM
Create a Home Valuation Report for This Property
The Home Valuation Report is an in-depth analysis detailing your home's value as well as a comparison with similar homes in the area
Home Values in the Area
Average Home Value in this Area
Purchase History
| Date | Buyer | Sale Price | Title Company |
|---|---|---|---|
| Jones Vicki Lea | -- | None Listed On Document | |
| Read Jacqueline L | -- | None Available | |
| Conley Casey H | -- | Fa |
Source: Public Records
Mortgage History
| Date | Status | Borrower | Loan Amount |
|---|---|---|---|
| Open | Jones Vicki Lea | $109,998 | |
| Previous Owner | Conley Casey H | $80,000 |
Source: Public Records
Tax History Compared to Growth
Tax History
| Year | Tax Paid | Tax Assessment Tax Assessment Total Assessment is a certain percentage of the fair market value that is determined by local assessors to be the total taxable value of land and additions on the property. | Land | Improvement |
|---|---|---|---|---|
| 2025 | $2,146 | $182,798 | $37,947 | $144,851 |
| 2024 | $2,146 | $190,460 | $43,821 | $146,639 |
| 2023 | $2,585 | $193,345 | $43,821 | $149,524 |
| 2022 | $2,642 | $161,130 | $33,596 | $127,534 |
| 2021 | $2,572 | $122,578 | $16,619 | $105,959 |
| 2020 | $2,560 | $119,655 | $16,619 | $103,036 |
| 2019 | $2,501 | $118,829 | $16,619 | $102,210 |
| 2018 | $2,262 | $103,985 | $12,310 | $91,675 |
| 2017 | $2,220 | $103,985 | $12,310 | $91,675 |
| 2016 | $2,085 | $97,673 | $12,310 | $85,363 |
| 2015 | $1,927 | $93,436 | $12,310 | $81,126 |
| 2014 | $1,927 | $90,692 | $12,310 | $78,382 |
Source: Public Records
Map
Nearby Homes
- 2320 Sarasota Dr
- 2331 Hunter St
- 2408 Hunter St
- 2713 Tanglewood Dr
- 2713 Brentwood Dr
- 2801 Valley View St
- 2103 Crestwood Dr
- 2126 McDonald Rd
- 1929 Oakhurst Cir
- 2110 Crestwood Dr
- 1920 McDonald Rd
- 2015 E 5th St
- 2010 McDonald Rd
- 2909 Meadowlark Ln
- 1715 Ridgeview Dr
- 2936 Rollingwood Dr
- 2006 McDonald Rd
- 2931 Meadow Brook Trail
- 2019 Woodhaven Dr
- 3014 Brentwood Dr
- 2506 Marilyn Dr
- 2512 2512 Marilyn Dr
- 2512 Marilyn Dr
- 2500 Marilyn Dr
- 2007 Glenbrook Dr
- 2000 S Boldt Ave
- 2000 2000 Boldt
- 1834 Sampson Dr
- 2002 Glenbrook Dr
- 2011 2011 Glenbrook
- 2011 Glenbrook Dr
- 1830 Sampson Dr
- 2010 S Boldt Ave
- 2010 2010 Boldt Ave
- 2010 2010 S Boldt Ave
- 2006 Glenbrook Dr
- 2017 Glenbrook Dr
- 2010 Glenbrook Dr
- 2419 Sampson Dr
- 2016 2016 S Boldt Ave