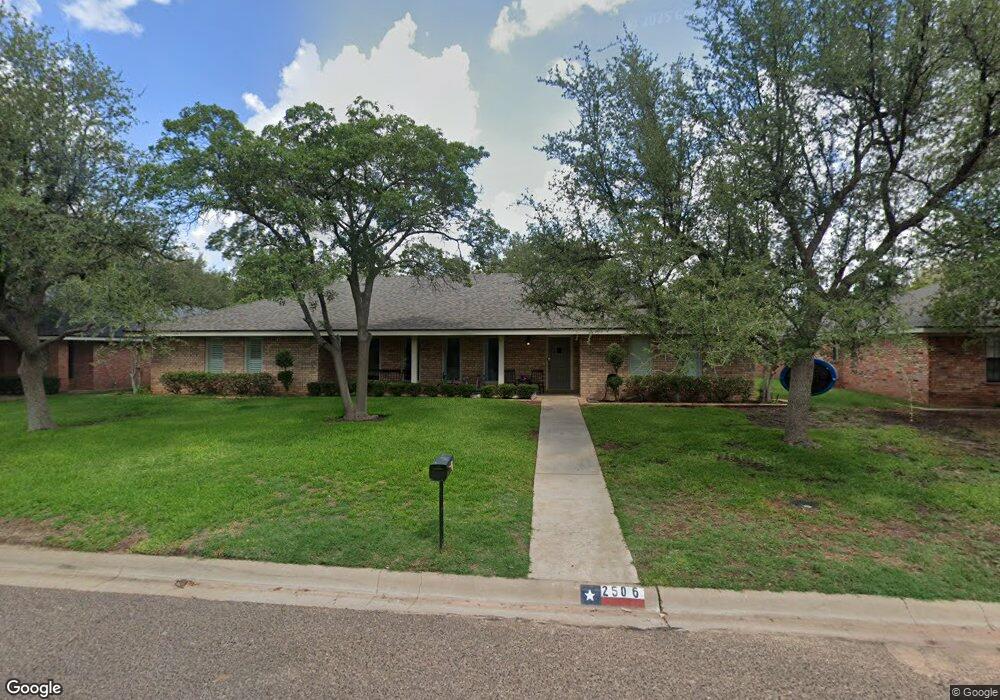
2506 Culpeper Dr Midland, TX 79705
Estimated Value: $488,000 - $603,000
--
Bed
2
Baths
3,138
Sq Ft
$169/Sq Ft
Est. Value
About This Home
This home is located at 2506 Culpeper Dr, Midland, TX 79705 and is currently estimated at $530,434, approximately $169 per square foot. 2506 Culpeper Dr is a home located in Midland County with nearby schools including Midland High School, Robert H. Goddard Junior High School, and The Hillander School.
Ownership History
Date
Name
Owned For
Owner Type
Purchase Details
Closed on
Nov 20, 2020
Sold by
Rensimer Andrew and Rensimer Jessica
Bought by
Kilgore Andrew and Kilgore Megan C
Current Estimated Value
Home Financials for this Owner
Home Financials are based on the most recent Mortgage that was taken out on this home.
Original Mortgage
$508,250
Outstanding Balance
$451,237
Interest Rate
2.8%
Mortgage Type
New Conventional
Estimated Equity
$79,197
Purchase Details
Closed on
Oct 13, 2015
Sold by
Sprouse Ted
Bought by
Rensimer Andrew and Rensimer Jessica
Home Financials for this Owner
Home Financials are based on the most recent Mortgage that was taken out on this home.
Original Mortgage
$264,000
Interest Rate
3.25%
Mortgage Type
Adjustable Rate Mortgage/ARM
Purchase Details
Closed on
Mar 6, 2012
Sold by
Mcdermett Michele and Ivey David
Bought by
Sprouse Ted
Purchase Details
Closed on
Aug 1, 1996
Bought by
Rensimer Andrew
Purchase Details
Closed on
Dec 17, 1979
Bought by
Rensimer Andrew
Create a Home Valuation Report for This Property
The Home Valuation Report is an in-depth analysis detailing your home's value as well as a comparison with similar homes in the area
Home Values in the Area
Average Home Value in this Area
Purchase History
| Date | Buyer | Sale Price | Title Company |
|---|---|---|---|
| Kilgore Andrew | -- | Stewart Title Company | |
| Rensimer Andrew | -- | Stc | |
| Sprouse Ted | -- | None Available | |
| Rensimer Andrew | -- | -- | |
| Rensimer Andrew | -- | -- |
Source: Public Records
Mortgage History
| Date | Status | Borrower | Loan Amount |
|---|---|---|---|
| Open | Kilgore Andrew | $508,250 | |
| Previous Owner | Rensimer Andrew | $264,000 |
Source: Public Records
Tax History Compared to Growth
Tax History
| Year | Tax Paid | Tax Assessment Tax Assessment Total Assessment is a certain percentage of the fair market value that is determined by local assessors to be the total taxable value of land and additions on the property. | Land | Improvement |
|---|---|---|---|---|
| 2025 | $5,644 | $442,170 | $31,510 | $410,660 |
| 2024 | $5,653 | $457,660 | $31,510 | $426,150 |
| 2023 | $5,396 | $445,740 | $31,510 | $414,230 |
| 2022 | $6,561 | $419,920 | $31,510 | $388,410 |
| 2021 | $7,041 | $404,170 | $31,510 | $372,660 |
| 2020 | $6,222 | $405,020 | $31,510 | $373,510 |
| 2019 | $8,376 | $388,520 | $31,510 | $373,510 |
| 2018 | $6,867 | $353,200 | $31,510 | $321,690 |
| 2017 | $6,461 | $332,300 | $31,510 | $300,790 |
| 2016 | $6,321 | $324,530 | $31,510 | $293,020 |
| 2015 | -- | $324,530 | $31,510 | $293,020 |
| 2014 | -- | $318,280 | $31,510 | $286,770 |
Source: Public Records
Map
Nearby Homes
- 2505 Maxwell Dr
- 5 Chatham Ct
- 2406 Dartmouth Dr
- 63 Ironwood Ct Unit 91
- 63 Ironwood Ct
- 2409 Stutz Place
- 2605 Inwood Ct
- 2406 Stutz Place
- 4 Amhurst Ct
- 19 Winchester Ct
- 2811 Durant Dr
- 2400 Metz Ct
- 2305 Auburn Place
- 2400 W Dengar Ave
- 2806 Auburn Dr
- 2601 W Dengar Ave
- 2817 Maxwell Dr
- 2613 Haynes Dr
- 3 Marinor Ct
- 2800 Cimmaron Ave
- 2508 Culpeper Dr
- 2504 Culpeper Dr
- 2505 Dartmouth Dr
- 2507 Dartmouth Dr
- 2507 Culpeper Dr
- 2502 Culpeper Dr
- 2505 Culpeper Dr
- 2510 Culpeper Dr
- 2509 Culpeper Dr
- 2503 Dartmouth Dr
- 2509 Dartmouth Dr
- 2512 Culpeper Dr
- 2500 Culpeper Dr
- 2511 Culpeper Dr
- 2503 Culpeper Dr
- 2501 Dartmouth Dr
- 2504 Dartmouth Dr
- 2506 Dartmouth Dr
- 8 Fairfax Ct
- 2502 Dartmouth Dr