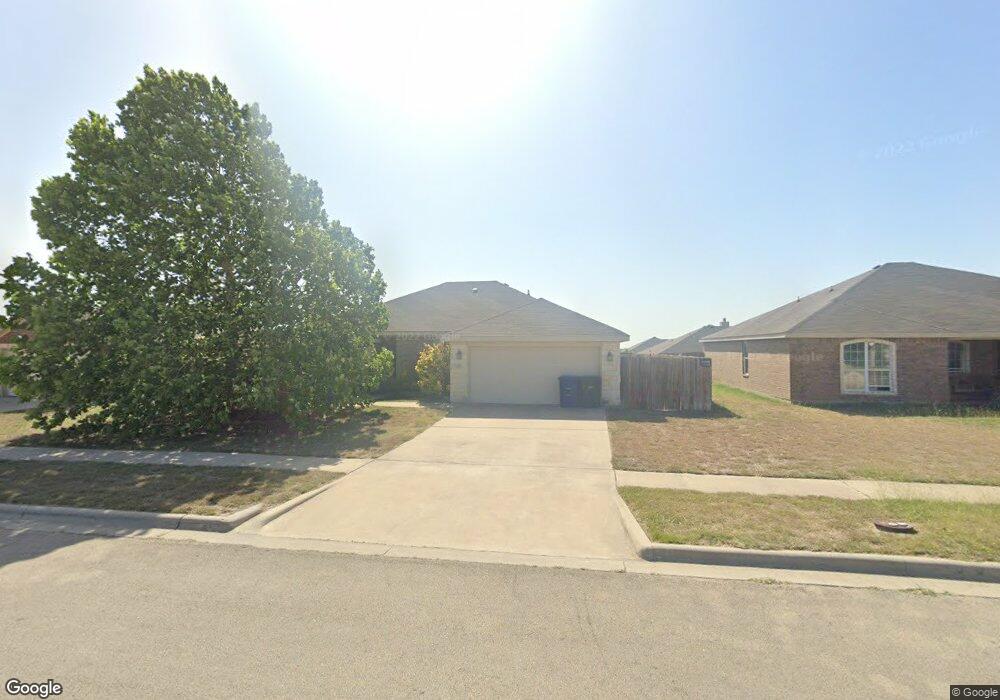
2506 Jake Dr Copperas Cove, TX 76522
Estimated Value: $230,134 - $242,000
4
Beds
2
Baths
1,629
Sq Ft
$145/Sq Ft
Est. Value
About This Home
This home is located at 2506 Jake Dr, Copperas Cove, TX 76522 and is currently estimated at $236,067, approximately $144 per square foot. 2506 Jake Dr is a home located in Coryell County with nearby schools including House Creek Elementary School, S.C. Lee Junior High School, and Copperas Cove High School.
Ownership History
Date
Name
Owned For
Owner Type
Purchase Details
Closed on
Jun 18, 2009
Sold by
Herring Clark K and Herring Ianka P
Bought by
Void Dana
Current Estimated Value
Home Financials for this Owner
Home Financials are based on the most recent Mortgage that was taken out on this home.
Original Mortgage
$131,262
Outstanding Balance
$83,246
Interest Rate
4.84%
Estimated Equity
$152,821
Purchase Details
Closed on
Sep 7, 2005
Sold by
Wright Jerry
Bought by
Herring Clark K and Herring Ianka P
Home Financials for this Owner
Home Financials are based on the most recent Mortgage that was taken out on this home.
Original Mortgage
$116,212
Interest Rate
5.8%
Create a Home Valuation Report for This Property
The Home Valuation Report is an in-depth analysis detailing your home's value as well as a comparison with similar homes in the area
Home Values in the Area
Average Home Value in this Area
Purchase History
| Date | Buyer | Sale Price | Title Company |
|---|---|---|---|
| Void Dana | -- | -- | |
| Herring Clark K | -- | -- |
Source: Public Records
Mortgage History
| Date | Status | Borrower | Loan Amount |
|---|---|---|---|
| Open | Void Dana | $131,262 | |
| Previous Owner | Herring Clark K | $116,212 |
Source: Public Records
Tax History Compared to Growth
Tax History
| Year | Tax Paid | Tax Assessment Tax Assessment Total Assessment is a certain percentage of the fair market value that is determined by local assessors to be the total taxable value of land and additions on the property. | Land | Improvement |
|---|---|---|---|---|
| 2025 | $3,139 | $219,254 | -- | -- |
| 2023 | $3,139 | $181,202 | $0 | $0 |
| 2022 | $3,696 | $198,570 | $40,000 | $158,570 |
| 2021 | $3,860 | $155,770 | $25,000 | $130,770 |
| 2020 | $3,565 | $136,140 | $22,000 | $114,140 |
| 2019 | $3,587 | $132,280 | $22,000 | $110,280 |
| 2018 | $3,429 | $126,390 | $22,000 | $104,390 |
| 2017 | $3,337 | $125,480 | $22,000 | $103,480 |
| 2016 | $3,340 | $125,590 | $22,000 | $103,590 |
| 2015 | $3,074 | $121,960 | $22,000 | $99,960 |
| 2014 | $3,074 | $126,070 | $22,000 | $104,070 |
Source: Public Records
Map
Nearby Homes