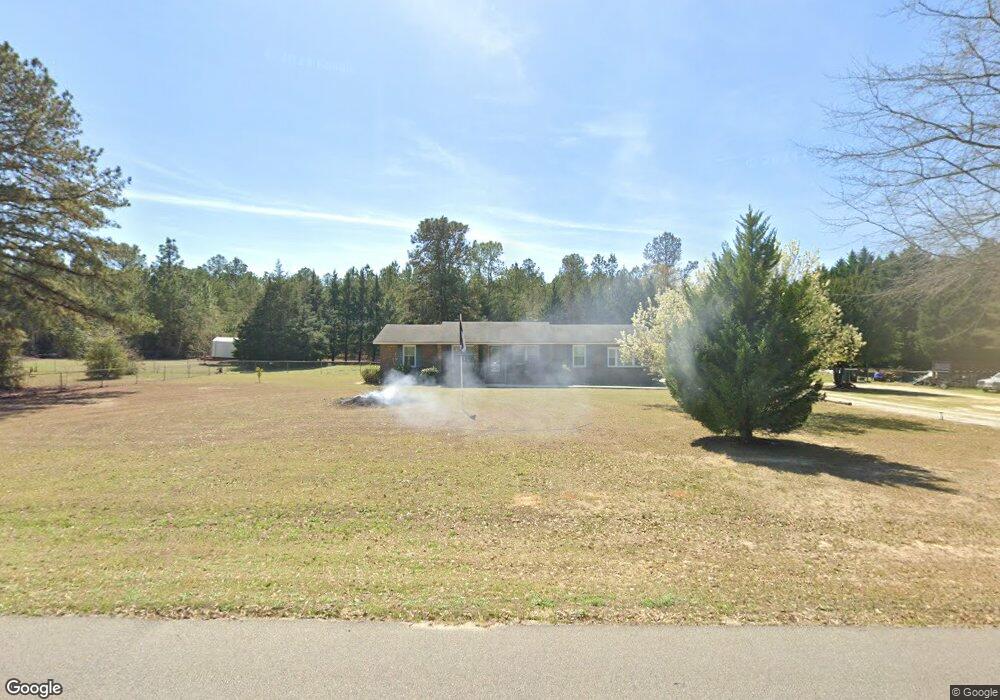
2506 Quail Run Dr Hephzibah, GA 30815
Farmers Bridge NeighborhoodEstimated Value: $198,000 - $327,000
3
Beds
2
Baths
1,716
Sq Ft
$140/Sq Ft
Est. Value
About This Home
This home is located at 2506 Quail Run Dr, Hephzibah, GA 30815 and is currently estimated at $239,892, approximately $139 per square foot. 2506 Quail Run Dr is a home located in Richmond County with nearby schools including Hephzibah Middle School, Johnson Magnet, and Hephzibah High School.
Ownership History
Date
Name
Owned For
Owner Type
Purchase Details
Closed on
Jun 3, 2011
Sold by
Copley Robert E
Bought by
Key Celeste D
Current Estimated Value
Home Financials for this Owner
Home Financials are based on the most recent Mortgage that was taken out on this home.
Original Mortgage
$99,900
Outstanding Balance
$69,137
Interest Rate
4.79%
Mortgage Type
New Conventional
Estimated Equity
$170,755
Purchase Details
Closed on
Mar 24, 2006
Sold by
Nelson Abbott Harry and Nichols Keith
Bought by
Copley Robert E and Stanford Melanie
Home Financials for this Owner
Home Financials are based on the most recent Mortgage that was taken out on this home.
Original Mortgage
$57,000
Interest Rate
6.25%
Mortgage Type
Fannie Mae Freddie Mac
Purchase Details
Closed on
Sep 9, 2005
Sold by
Jones Dorothea Cody
Bought by
Nelson Abbott Harry and Nichols Keith
Create a Home Valuation Report for This Property
The Home Valuation Report is an in-depth analysis detailing your home's value as well as a comparison with similar homes in the area
Home Values in the Area
Average Home Value in this Area
Purchase History
| Date | Buyer | Sale Price | Title Company |
|---|---|---|---|
| Key Celeste D | $89,900 | -- | |
| Copley Robert E | $114,000 | None Available | |
| Nelson Abbott Harry | $76,000 | -- |
Source: Public Records
Mortgage History
| Date | Status | Borrower | Loan Amount |
|---|---|---|---|
| Open | Key Celeste D | $99,900 | |
| Previous Owner | Copley Robert E | $57,000 |
Source: Public Records
Tax History Compared to Growth
Tax History
| Year | Tax Paid | Tax Assessment Tax Assessment Total Assessment is a certain percentage of the fair market value that is determined by local assessors to be the total taxable value of land and additions on the property. | Land | Improvement |
|---|---|---|---|---|
| 2025 | $1,756 | $68,828 | $4,356 | $64,472 |
| 2024 | $1,756 | $70,680 | $4,356 | $66,324 |
| 2023 | $1,372 | $57,920 | $4,356 | $53,564 |
| 2022 | $1,100 | $41,862 | $4,356 | $37,506 |
| 2021 | $813 | $28,249 | $4,356 | $23,893 |
| 2020 | $796 | $28,249 | $4,356 | $23,893 |
| 2019 | $854 | $28,249 | $4,356 | $23,893 |
| 2018 | $845 | $27,875 | $4,356 | $23,519 |
| 2017 | $845 | $27,875 | $4,356 | $23,519 |
| 2016 | $845 | $27,875 | $4,356 | $23,519 |
| 2015 | -- | $27,875 | $4,356 | $23,519 |
| 2014 | -- | $27,875 | $4,356 | $23,519 |
Source: Public Records
Map
Nearby Homes
- 2016 Elite Ct
- 2712 Big Dog Trail
- 2687 Big Dog Tr
- 3012 Old Lodge Rd
- 2664 New Hope Cir
- 2250 Hephzibah - McBean Rd
- 1351 Hephzibah - McBean Rd
- 1503 Hephzibah - McBean Rd
- 4425 Reynolds St
- 2597 Highway 88
- 5225 Farmers Bridge Rd
- 4214 Windsor Spring Rd
- 4389 Clements Rd
- 4731 Windsor Spring Rd
- 2160 Louisa Rd
- 2405 Hwy 88
- 4927 Fulcher Rd
- 4635 Windsor Spring Rd
- 2236 Ga Highway 88
- 4012 Peach Orchard Rd
- 2504 Quail Run Dr
- 2514 Quail Run Dr
- 2507 Quail Run Dr
- 2502 Quail Run Dr
- 2529 Quail Run Dr
- 4699 Storey Mill Rd
- 2515 Quail Run Dr
- 4697 Storey Mill Rd
- 2518 Quail Run Dr
- 2521 Quail Run Dr
- 4724 Story Mill Rd
- 4722 Storey Mill Rd
- 4695 Storey Mill Rd
- 2522 Quail Run Dr
- 4726 Storey Mill Rd
- 4720 Story Mill Rd
- 4728 Story Mill Rd
- 4728 Storey Mill Rd
- 4693 Storey Mill Rd
- 4732 Storey Mill Rd