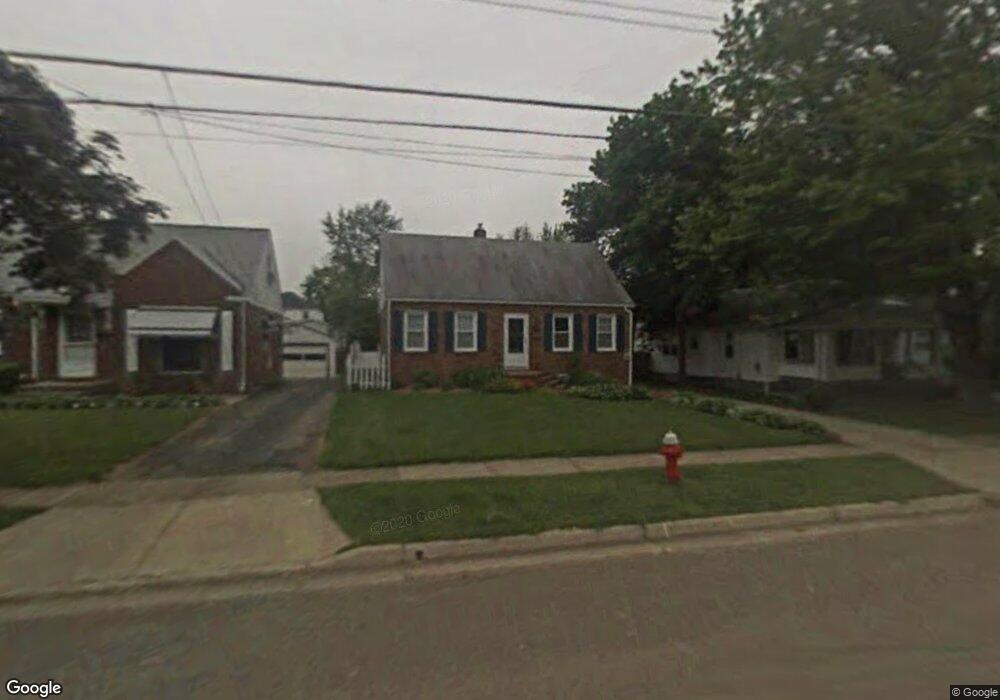
2507 9th St Cuyahoga Falls, OH 44221
Mud Brook NeighborhoodEstimated Value: $153,000 - $187,017
3
Beds
1
Bath
768
Sq Ft
$222/Sq Ft
Est. Value
About This Home
This home is located at 2507 9th St, Cuyahoga Falls, OH 44221 and is currently estimated at $170,254, approximately $221 per square foot. 2507 9th St is a home located in Summit County with nearby schools including Dewitt Elementary School, Bolich Middle School, and Cuyahoga Falls High School.
Ownership History
Date
Name
Owned For
Owner Type
Purchase Details
Closed on
Jun 7, 2006
Sold by
Craven Corp
Bought by
Smith Mary A
Current Estimated Value
Purchase Details
Closed on
Feb 26, 2003
Sold by
Richardson Douglas M and Richardson Laura D
Bought by
Craven Corp
Purchase Details
Closed on
Sep 30, 1994
Sold by
Knotts Patricia M
Bought by
Richardson Douglas M and Richardson Laura D
Home Financials for this Owner
Home Financials are based on the most recent Mortgage that was taken out on this home.
Original Mortgage
$70,200
Interest Rate
8.6%
Mortgage Type
New Conventional
Create a Home Valuation Report for This Property
The Home Valuation Report is an in-depth analysis detailing your home's value as well as a comparison with similar homes in the area
Home Values in the Area
Average Home Value in this Area
Purchase History
| Date | Buyer | Sale Price | Title Company |
|---|---|---|---|
| Smith Mary A | $108,000 | Land America-Lawyers Title | |
| Craven Corp | $86,000 | Multiple | |
| Richardson Douglas M | $73,900 | -- |
Source: Public Records
Mortgage History
| Date | Status | Borrower | Loan Amount |
|---|---|---|---|
| Previous Owner | Richardson Douglas M | $70,200 |
Source: Public Records
Tax History Compared to Growth
Tax History
| Year | Tax Paid | Tax Assessment Tax Assessment Total Assessment is a certain percentage of the fair market value that is determined by local assessors to be the total taxable value of land and additions on the property. | Land | Improvement |
|---|---|---|---|---|
| 2025 | $2,314 | $52,032 | $9,615 | $42,417 |
| 2024 | $2,314 | $52,032 | $9,615 | $42,417 |
| 2023 | $2,314 | $52,032 | $9,615 | $42,417 |
| 2022 | $2,017 | $39,095 | $7,175 | $31,920 |
| 2021 | $2,017 | $39,095 | $7,175 | $31,920 |
| 2020 | $1,984 | $39,100 | $7,180 | $31,920 |
| 2019 | $1,757 | $33,220 | $7,180 | $26,040 |
| 2018 | $1,492 | $33,220 | $7,180 | $26,040 |
| 2017 | $1,786 | $33,220 | $7,180 | $26,040 |
| 2016 | $1,788 | $29,690 | $7,180 | $22,510 |
| 2015 | $1,786 | $29,690 | $7,180 | $22,510 |
| 2014 | $1,787 | $29,690 | $7,180 | $22,510 |
| 2013 | $1,941 | $32,520 | $7,180 | $25,340 |
Source: Public Records
Map
Nearby Homes