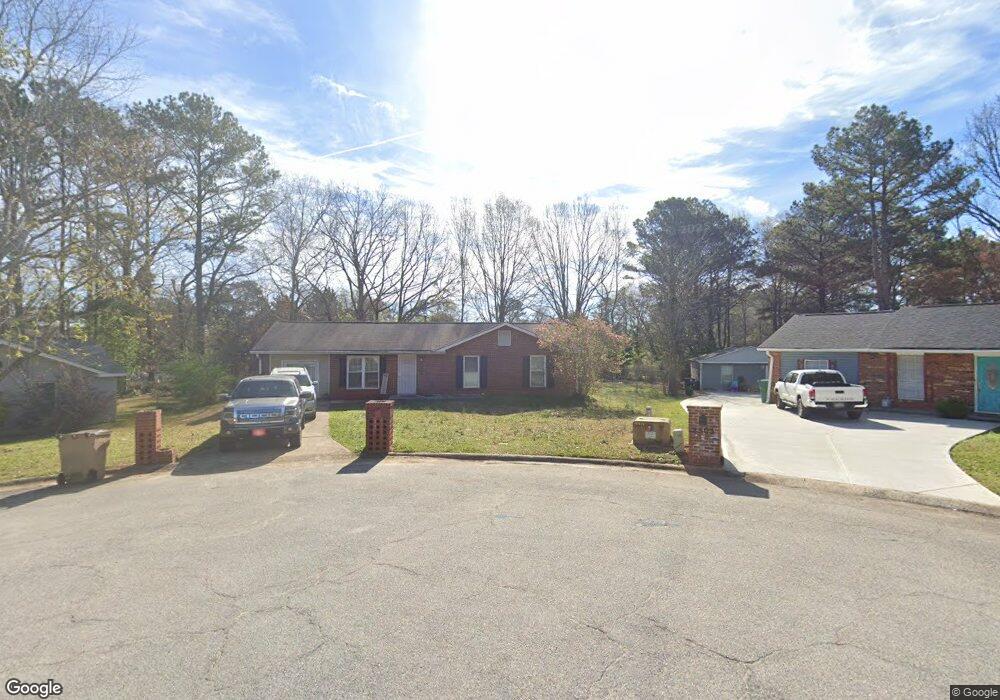
2507 Bellemeade Ct Morrow, GA 30260
Estimated Value: $208,424 - $230,000
3
Beds
2
Baths
1,100
Sq Ft
$198/Sq Ft
Est. Value
About This Home
This home is located at 2507 Bellemeade Ct, Morrow, GA 30260 and is currently estimated at $217,856, approximately $198 per square foot. 2507 Bellemeade Ct is a home located in Clayton County with nearby schools including Thurgood Marshall Elementary School, Morrow Middle School, and Morrow High School.
Ownership History
Date
Name
Owned For
Owner Type
Purchase Details
Closed on
Sep 25, 2020
Sold by
Milligan Valencia A
Bought by
Williams Catrina
Current Estimated Value
Home Financials for this Owner
Home Financials are based on the most recent Mortgage that was taken out on this home.
Original Mortgage
$133,536
Outstanding Balance
$118,773
Interest Rate
2.9%
Mortgage Type
FHA
Estimated Equity
$99,083
Purchase Details
Closed on
Aug 15, 2007
Sold by
Cardozo Pedro
Bought by
Milligan Valencia A
Home Financials for this Owner
Home Financials are based on the most recent Mortgage that was taken out on this home.
Original Mortgage
$93,950
Interest Rate
6.65%
Mortgage Type
New Conventional
Purchase Details
Closed on
Mar 28, 2007
Sold by
Vaccaro Marie A
Bought by
Cardozo Pedro
Home Financials for this Owner
Home Financials are based on the most recent Mortgage that was taken out on this home.
Original Mortgage
$48,000
Interest Rate
8%
Mortgage Type
New Conventional
Create a Home Valuation Report for This Property
The Home Valuation Report is an in-depth analysis detailing your home's value as well as a comparison with similar homes in the area
Home Values in the Area
Average Home Value in this Area
Purchase History
| Date | Buyer | Sale Price | Title Company |
|---|---|---|---|
| Williams Catrina | $136,000 | -- | |
| Milligan Valencia A | $98,900 | -- | |
| Cardozo Pedro | $60,000 | -- |
Source: Public Records
Mortgage History
| Date | Status | Borrower | Loan Amount |
|---|---|---|---|
| Open | Williams Catrina | $133,536 | |
| Previous Owner | Milligan Valencia A | $93,950 | |
| Previous Owner | Cardozo Pedro | $48,000 |
Source: Public Records
Tax History Compared to Growth
Tax History
| Year | Tax Paid | Tax Assessment Tax Assessment Total Assessment is a certain percentage of the fair market value that is determined by local assessors to be the total taxable value of land and additions on the property. | Land | Improvement |
|---|---|---|---|---|
| 2024 | $2,824 | $82,400 | $7,200 | $75,200 |
| 2023 | $3,070 | $85,040 | $7,200 | $77,840 |
| 2022 | $2,024 | $61,560 | $7,200 | $54,360 |
| 2021 | $2,117 | $53,600 | $7,200 | $46,400 |
| 2020 | $598 | $39,918 | $7,200 | $32,718 |
| 2019 | $412 | $30,006 | $4,800 | $25,206 |
| 2018 | $358 | $27,388 | $4,800 | $22,588 |
| 2017 | $244 | $21,282 | $4,800 | $16,482 |
| 2016 | $329 | $18,084 | $4,800 | $13,284 |
| 2015 | $332 | $0 | $0 | $0 |
| 2014 | $201 | $15,026 | $6,400 | $8,626 |
Source: Public Records
Map
Nearby Homes
- 2436 Wood Valley Dr
- 6205 Fieldcrest Dr
- 6155 Landover Cir Unit 2
- 6010 Fieldcrest Dr
- 6181 Castlewood Dr
- 6046 Danbury Ct
- 2306 Santa fe St Unit 9
- 2278 Santa fe St Unit 18
- 2280 Santa fe St Unit 17
- 6076 Mount Zion Blvd
- 2455 Lake Harbin Rd
- 2731 Lynn Ct
- 6188 Cinnamon Ct
- 5871 Dan Dr
- 6082 Kathie Ct
- 2718 Somerton Dr
- 2609 Lake Harbin Rd
- 2649 Lake Harbin Rd
- 5790 Twain Dr
- 6177 Meadowwood Dr
- 2503 Bellemeade Ct
- 6099 Fieldcrest Dr
- 6091 Fieldcrest Dr
- 2506 Bellemeade Ct
- 6107 Fieldcrest Dr
- 2501 Hobson Cove
- 6081 Fieldcrest Dr
- 2508 Hobson Cove
- 2502 Bellemeade Ct Unit 4
- 6098 Deerfield Ct
- 6115 Fieldcrest Dr Unit 3
- 6108 Deerfield Ct
- 6073 Fieldcrest Dr Unit 4
- 0 Hobson Cove Unit 8428161
- 0 Hobson Cove Unit 8335396
- 6030 Fieldcrest Dr
- 0 Fieldcrest Dr Unit 7521546
- 0 Fieldcrest Dr Unit 7425141
- 0 Fieldcrest Dr Unit 7164728
- 0 Fieldcrest Dr Unit 3232599