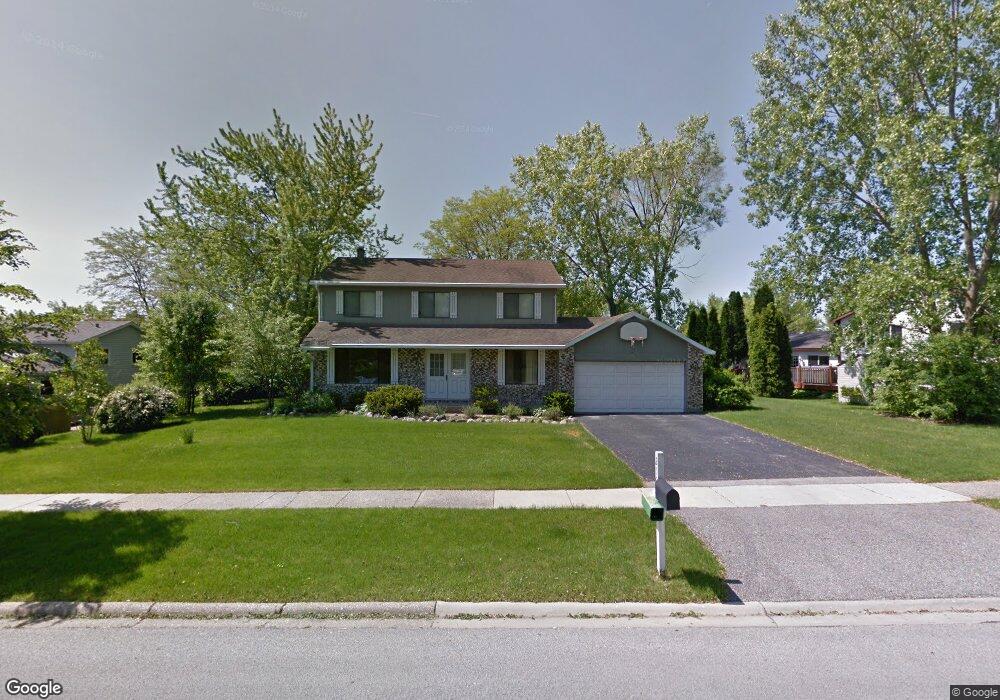
2507 Forest View Rd Lindenhurst, IL 60046
Estimated Value: $381,307 - $403,000
3
Beds
3
Baths
2,343
Sq Ft
$167/Sq Ft
Est. Value
About This Home
This home is located at 2507 Forest View Rd, Lindenhurst, IL 60046 and is currently estimated at $391,577, approximately $167 per square foot. 2507 Forest View Rd is a home located in Lake County with nearby schools including Millburn Elementary School, Millburn Middle School, and Lakes Community High School.
Ownership History
Date
Name
Owned For
Owner Type
Purchase Details
Closed on
Aug 15, 2000
Sold by
King James L and King Jodi L
Bought by
Meder Paul G and Meder Angela Minnier
Current Estimated Value
Home Financials for this Owner
Home Financials are based on the most recent Mortgage that was taken out on this home.
Original Mortgage
$153,650
Outstanding Balance
$55,476
Interest Rate
8.16%
Estimated Equity
$336,101
Purchase Details
Closed on
May 29, 1998
Sold by
Phillips Paul P and Phillips Barbara R
Bought by
King James L and King Jodi L
Home Financials for this Owner
Home Financials are based on the most recent Mortgage that was taken out on this home.
Original Mortgage
$140,400
Interest Rate
7.27%
Purchase Details
Closed on
Nov 21, 1994
Sold by
Phillips Paul P and Phillips Barbara R
Bought by
Phillips Paul P and Phillips Linda R
Create a Home Valuation Report for This Property
The Home Valuation Report is an in-depth analysis detailing your home's value as well as a comparison with similar homes in the area
Home Values in the Area
Average Home Value in this Area
Purchase History
| Date | Buyer | Sale Price | Title Company |
|---|---|---|---|
| Meder Paul G | $205,000 | -- | |
| King James L | $175,500 | -- | |
| Phillips Paul P | -- | -- |
Source: Public Records
Mortgage History
| Date | Status | Borrower | Loan Amount |
|---|---|---|---|
| Open | Meder Paul G | $153,650 | |
| Previous Owner | King James L | $140,400 |
Source: Public Records
Tax History
| Year | Tax Paid | Tax Assessment Tax Assessment Total Assessment is a certain percentage of the fair market value that is determined by local assessors to be the total taxable value of land and additions on the property. | Land | Improvement |
|---|---|---|---|---|
| 2024 | $9,667 | $106,336 | $14,438 | $91,898 |
| 2023 | $11,796 | $93,953 | $12,757 | $81,196 |
| 2022 | $11,796 | $93,362 | $11,388 | $81,974 |
| 2021 | $11,364 | $86,728 | $10,579 | $76,149 |
| 2020 | $10,959 | $83,949 | $10,240 | $73,709 |
| 2019 | $10,988 | $80,681 | $9,841 | $70,840 |
| 2018 | $10,085 | $79,334 | $14,507 | $64,827 |
| 2017 | $9,785 | $77,218 | $14,120 | $63,098 |
| 2016 | $9,729 | $74,091 | $13,548 | $60,543 |
| 2015 | $9,273 | $69,198 | $12,653 | $56,545 |
| 2014 | $9,844 | $66,680 | $12,712 | $53,968 |
| 2012 | $8,816 | $78,916 | $14,297 | $64,619 |
Source: Public Records
Map
Nearby Homes
- 697 Providence Ln
- 622 Oxford Ct
- 533 N Beck Rd Unit 28
- 19135 W Millburn Rd
- 2375 Kelsey Ct
- 412 Northgate Rd Unit 27
- 394 Northgate Rd
- 1896 E Vista Terrace
- 1903 Hazelwood Dr
- 73 S Beck Rd
- 1809 Maplewood Ct
- 2407 Valley Dr
- 210 Hazelwood Dr
- 3210 Neubauer Cir
- 1906 Fairfield Rd
- 1406 Neubauer Cir Unit 1904
- 1811 Longmeadow Dr Unit 17
- 102 Hawthorne Dr
- 2303 Neubauer Cir Unit 312
- 405 Woodland Trail
- 583 White Birch Rd
- 577 White Birch Rd
- 574 Waterford Dr
- 578 Waterford Dr
- 2510 Forest View Rd
- 2502 Forest View Rd
- 2494 Forest View Rd
- 566 Waterford Dr
- 2522 Forest View Rd
- 565 White Birch Rd
- 2482 Forest View Rd Unit 1
- 2465 Forest View Rd
- 575 Waterford Dr
- 2470 Forest View Rd
- 576 White Birch Rd
- 558 Waterford Dr
- 559 White Birch Rd
- 569 Waterford Dr
- 570 White Birch Rd
- 2546 Forest View Rd
Your Personal Tour Guide
Ask me questions while you tour the home.